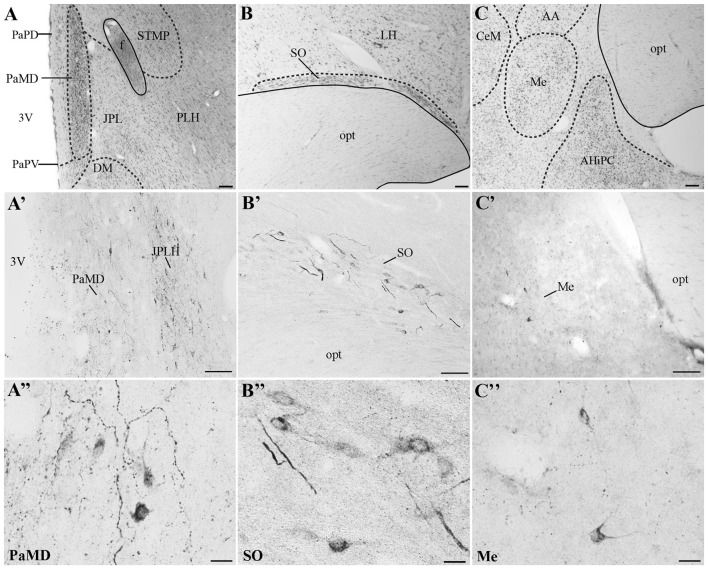
Figure 4.
Distribution of UCN3-ir cells in the central nervous system (CNS) of Sapajus spp. A series of bright field images showing representative regions that display the highest densities of UCN3-ir labeled cells. Nissl stained regions of (A) hypothalamus, (B) supraoptic nucleus, (C) amygdala. Dashed lines show nuclear boundaries. (A′,A″) Bright field photomicrographs demonstrating UCN3-ir neurons in the PaMD and juxtaparaventricular part of lateral hypothalamus (JPLH; B′,B″) in the SO and, (C′,C″) in the Me. Scale bars: (A,C) 200 μm; (B,A′,B′,C′) 100 μm; (A″–C″) 20 μm.

