
Figure 3.
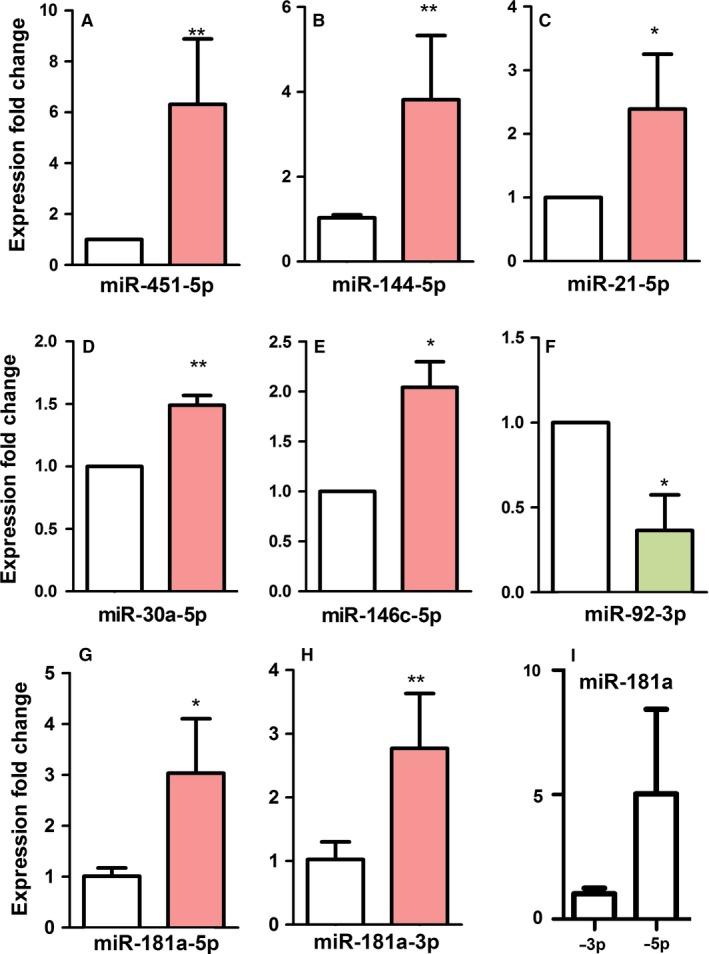
(A–I) Quantitative polymerase chain reaction (qPCR) analysis of the expression levels of the miR‐451, miR‐144, miR‐21, miR‐30, miR146, miR‐92 and miR‐181a in interdigits at 6 id (29HH stage) vs. 7.5 id interdigits (32HH stage). (A–E) The data confirmed the upregulation of (A) miR‐451, (B) miR‐144, (C) miR‐21, (D) miR‐30, (E) miR‐146 and (G,H) miR181a at 7.5 id (red right bars) when compared with the expression level at 6 id (white left bars). In the case of miR‐181a, both miR‐181a‐5′ and miR‐181a‐3′ were highly expressed and upregulated at stages of interdigital cell death. (I) Comparison of the expression levels of miR‐181a‐3′ and miR‐181a‐5′ at 7.5 id. (F) qPCR data also confirmed the downregulation of miR‐92 at 7.5 id (green right bar) with respect to the expression level at 6 id (left white bar) in the course of interdigital cell death. *P‐value > 0.05; **P‐value > 0.01.