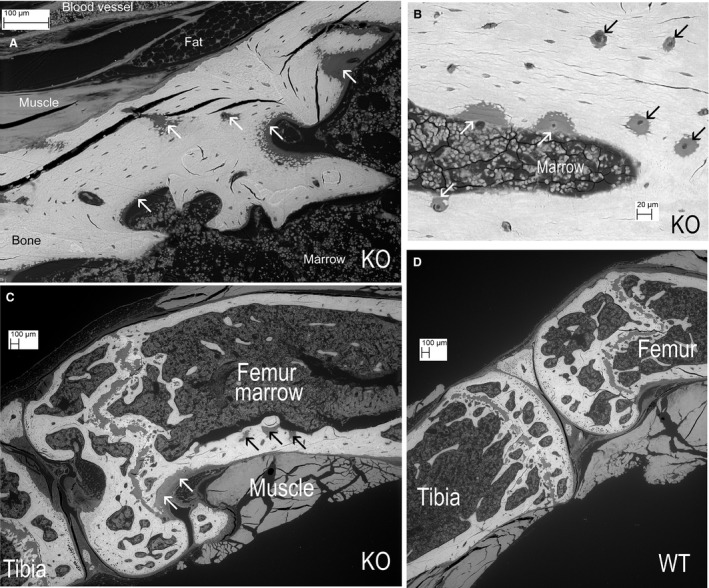
Figure 2.

(A) Knockout (KO). Proximal tibia showing many patches of mineralised matrix within areas of non‐mineralised matrix osteoid (white arrows). (B) KO. Tibial diaphysis. White arrows show osteoid patches at endosteal, marrow surface. Black arrows show variation in the size of osteoid areas (down to zones 20–50 μm across) centred on the blood vessel canals in the cortex. (C) KO. Knee. Dense fibrous connective tissue of periosteum at white arrows, not to be confused with osteoid areas in cortex at black arrows. (D) Wild‐type (WT) control knee, same scale.
