
Figure 3.
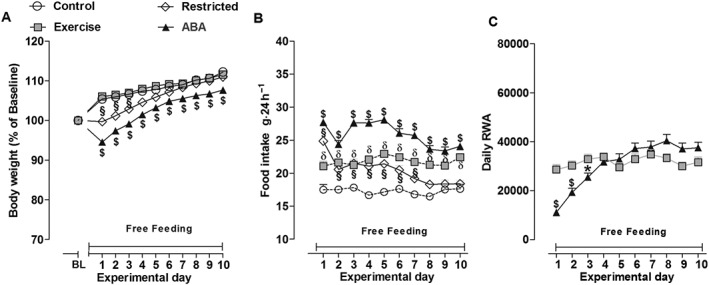
Body weight (A), food intake (B) and RWA (C) in Control, Exercise, Restricted and ABA groups during the 10 days of recovery from ABA. Results are presented as the mean ± SEM (n = 42 rats per group). Statistical analysis was performed by two‐way ANOVA followed by Bonferroni post hoc test (Body weight: $P < 0.05 vs Restricted, Exercise and Control rats, §P < 0.05 vs Exercise and Control rats; food intake: $P < 0.05 vs Restricted, Exercise and Control rats, §P < 0.05 and δP < 0.05 vs Control rats; RWA: $P < 0.05 vs Exercise rats).