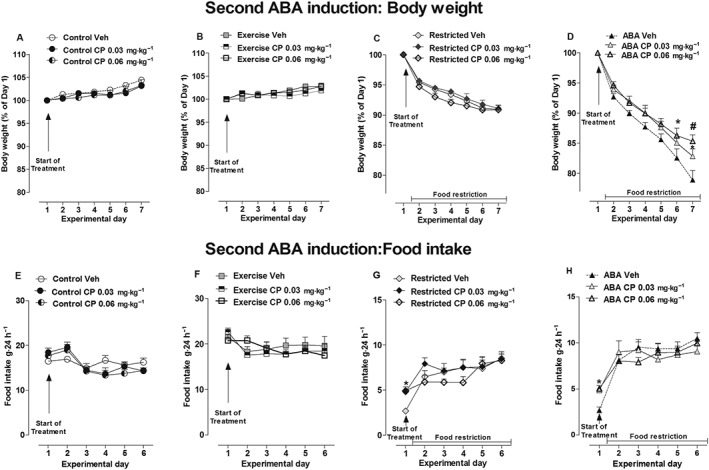
Figure 6.

Effect of CP administration (0.03 and 0.06 mg·kg−1) on body weight (A–C) and food intake (E–H) in Control, Exercise, Restricted and ABA groups during the 6 days of the second ABA induction. Results are presented as the mean ± SEM (n = 7 rats per dose). Statistical analysis was performed by two‐way ANOVA followed by Bonferroni post hoc test (body weight: *P < 0.05 vs vehicle; food intake: *P < 0.05 vs vehicle).
