
Figure 1.
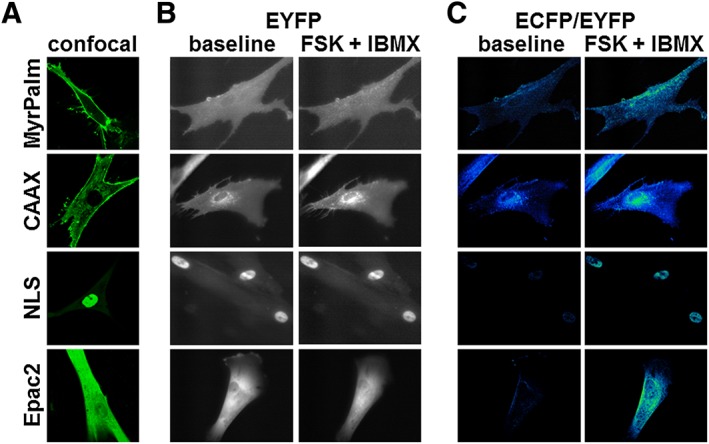
Expression pattern of Epac2‐based biosensors targeted to different subcellular locations. (A) Representative confocal images of human ASM cells expressing Epac2‐MyrPalm (MyrPalm, n = 27), Epac2‐CAAX (CAAX, n = 68), Epac2‐NLS (NLS, n = 25) and Epac2‐camps (Epac2, n = 18). (B) Representative wide‐field images (EYFP fluorescence) before (left) and after (right) stimulation of cAMP production by exposure to the AC activator forskolin (FSK, 10 μM) plus the PDE inhibitor IBMX (100 μM). Note that there is no obvious change in distribution of biosensor following stimulation of cAMP production. (C) Corresponding pseudocolour images depicting the change in ECFP/EYFP fluorescence intensity ratio before (left) and after (right) exposure to FSK plus IBMX. MyrPalm (n = 6), CAAX (n = 6), NLS (n = 9) and Epac2 (n = 8).