
Figure 2.
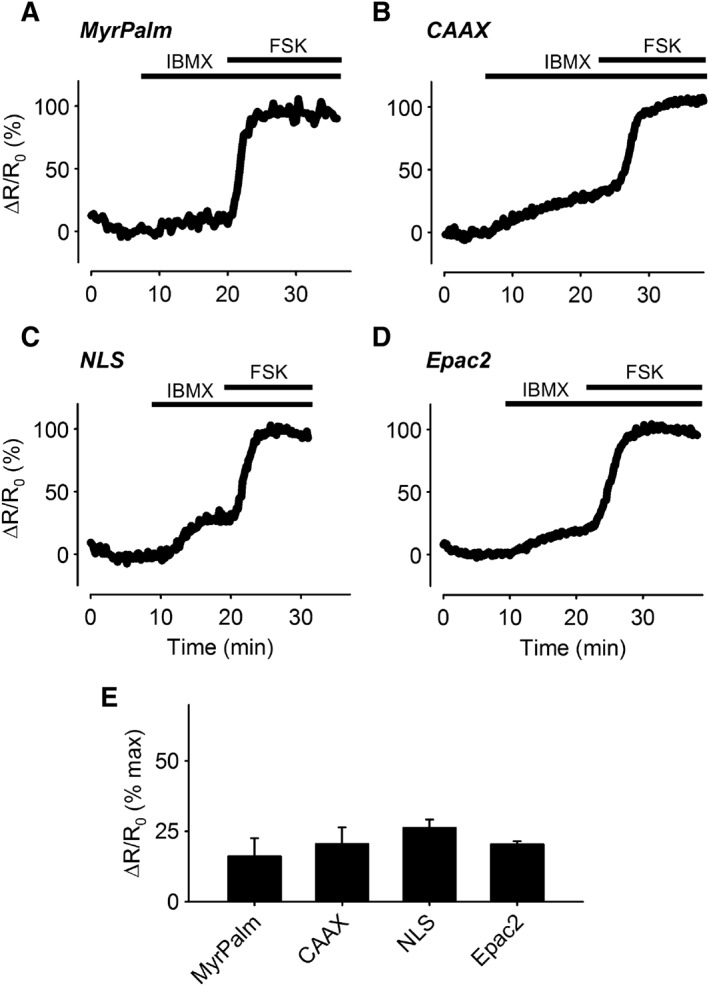
Changes in cAMP responses in different subcellular domains following PDE inhibition. (A–D) Representative time course of changes in the magnitude of the normalized FRET response (ΔR/R0) in human ASM cells expressing Epac2‐MyrPalm (MyrPalm), Epac2‐CAAX (CAAX), Epac2‐NLS (NLS) and Epac2‐camps (Epac2), under control conditions, following exposure to 100 μM IBMX, and IBMX plus 10 μM forskolin (FSK). (E) Size of average FRET response to 100 μM IBMX alone normalized to the magnitude of the maximal response measured in the presence of IBMX plus FSK. There was no statistical difference (one‐way ANOVA) in the size of the responses detected by MyrPalm (n = 6), CAAX (n = 6), NLS (n = 9) and Epac2 (n = 8).