
Figure 6.
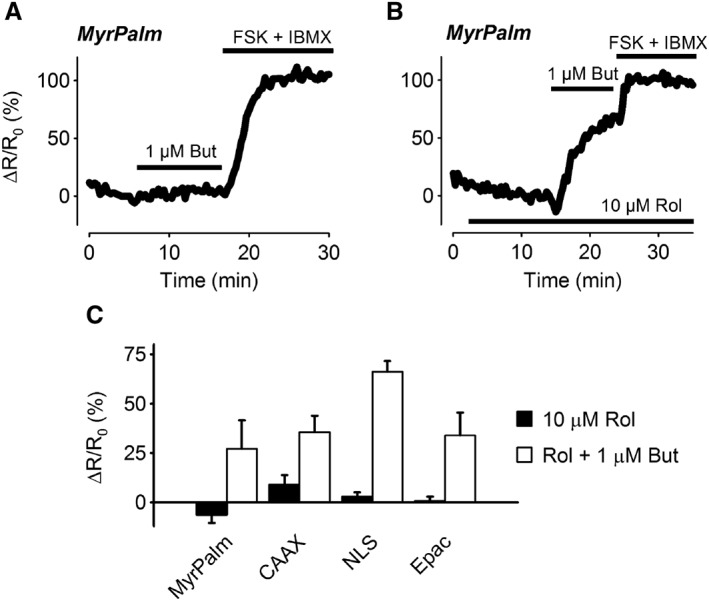
Effect of PDE4 inhibition on cAMP responses elicited by EP2 receptor stimulation. Representative time course of changes in the magnitude of the FRET response (ΔR/R0) in cells expressing Epac2‐MyrPalm (MyrPalm), following exposure to 1 μM butaprost (But) in the absence (A) or presence (B) of the PDE4 inhibitor rolipram (Rol, 10 μM). (C) Size of average FRET responses to 10 μM Rol or Rol plus 1 μM butaprost. There were no significant differences in the size of the responses to 1 μM Rol detected by MyrPalm (n = 10), Epac2‐CAAX (CAAX; n = 8), Epac2‐NLS (NLS; n = 6) and Epac2‐camps (Epac2; n = 5). There were also no significant differences in the size of the responses to 1 μM butaprost in the presence of 10 μM Rol detected by MyrPalm (n = 7), CAAX (n = 8), NLS (n = 6) and Epac2 (n = 5). Statistical significance was tested using one‐way ANOVA. All responses were normalized to the maximal response elicited by 10 μM forskolin (FSK) plus 100 μM IBMX.