
Figure 7.
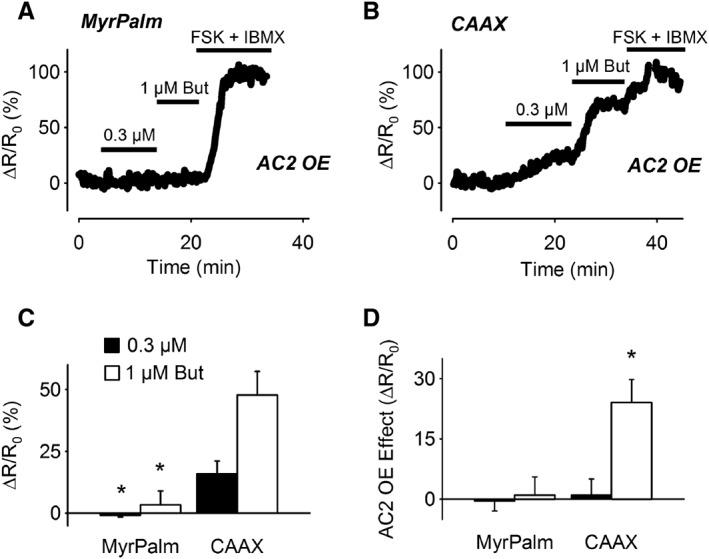
Effect of AC2 overexpression on cAMP responses elicited by EP2 receptor stimulation. Representative time course of changes in the normalized FRET response (ΔR/R0) detected by Epac2‐MyrPalm (MyrPalm) (A) and Epac2‐CAAX (CAAX) (B) following exposure to 0.3 and 1 μM butaprost in cells overexpressing AC2. (C) Size of average FRET responses in AC2 overexpressing (AC2 OE) cells. The size of the response to 0.3 μM butaprost detected by MyrPalm (n = 5) was significantly smaller than that detected by CAAX (n = 9). The size of the response to 1 μM butaprost detected by MyrPalm (n = 3) was also significantly smaller than that detected by CAAX (n = 9). (D) Difference in magnitude of butaprost responses due to AC2 overexpression (OE); 0.3 μM butaprost responses: MyrPalm (n = 11); CAAX (n = 12); 1 μM butaprost responses: MyrPalm (n = 11); CAAX (n = 10). The effect of AC2 overexpression on the response to 1 μM butaprost detected by CAAX was significantly greater than that detected by MyrPalm. Statistical significance was tested using one‐way ANOVA followed by Holm‐Sidak method for pairwise multiple comparisons. All responses were normalized to the maximal response elicited by 10 μM forskolin (FSK) plus 100 μM IBMX.