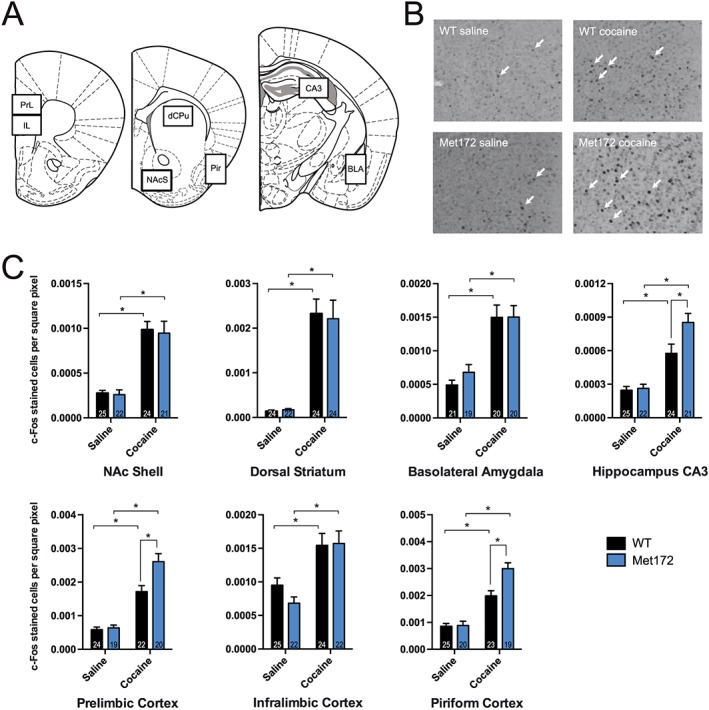
Figure 5.

Identification of brain regions where SERT‐inhibition had a significant contribution to c‐Fos expression. Brains from WT and SERT Met172 mice were collected 120 min after a single dose of cocaine (20 mg·kg−1, i.p.) or saline. (A) Areas in which stained nuclei were quantified (BLA, basolateral amygdala; CA3, hippocampal CA3; dCPu, dorsal caudate putamen; IL, infralimbic cortex; NAcS, nucleus accumbens shell; pir, piriform cortex; PrL, prelimbic cortex). (B) Representative pictures of c‐Fos positive stained nuclei in the prelimbic cortex. (C) Quantified c‐Fos expression as marker for neuronal activity in selected brain areas for saline and cocaine‐treated mice. Using two‐way ANOVA, we found significant main treatment effects in all brain areas displayed here, and additionally a significant main genotype effect in the CA3, piriform cortex and PrL. Data plotted are means ± SEM; n = 19–25; exact group sizes are indicated in the graphs. *P < 0.05, signficantly different as indicated; Sidak post hoc test.
