Figure 9.

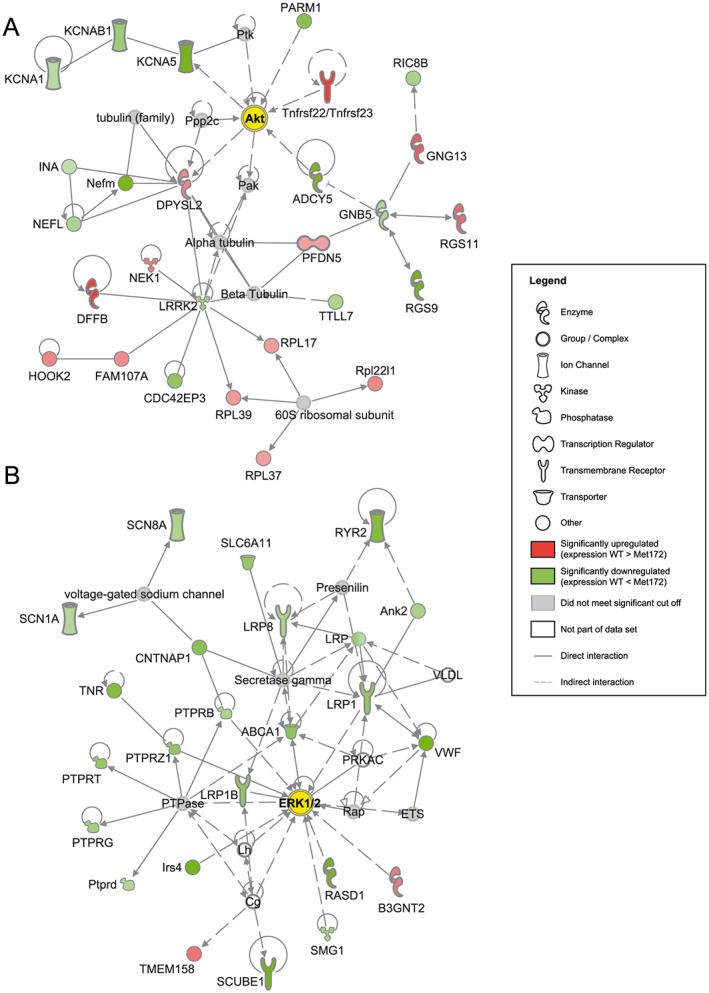
Representative gene networks that were significantly regulated (P < 0.05 with the Fisher's exact test) in response to cocaine in WT compared to SERT Met172 mice. Gene expression was assessed using RNA‐Seq and figures were generated by Ingenuity Pathway Analysis Path Designer (Qiagen). (A) Network centred around the network hub genes Akt (Akt1) in the PrL after acute cocaine treatment (20 mg·kg−1). (B) Network centred around the network hub genes ERK1/2 (Mapk1 and Mapk3) in the NAc after chronic cocaine treatment (5 days, 15 mg·kg−1 daily). Seed molecules from the list of differentially regulated genes in WT compared to SERT Met172 mice are shown in the form of protein networks in red (upregulated in WT) or green (down‐regulated in WT), along with other molecules (grey and white) that connect smaller networks to make larger networks. Darker green or red indicates higher statistical significance for differential gene expression. Interaction or regulation between proteins or complexes is shown with arrows (activation) or blunt‐ended lines (inhibition). See Supporting Information Figures S7 and S11 for subcellular network versions of panels A and B.
