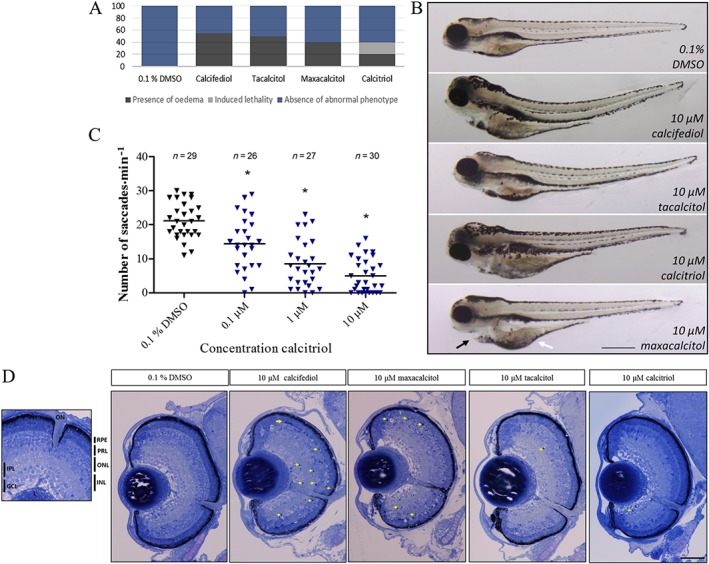
Figure 4.

VDR agonist treatment safety profile in zebrafish larvae. Zebrafish larval gross morphology, visual response and ocular histology after 10 μM VDR agonist treatment from 2 to 5 dpf. (A) Quantitative representation of the % of larvae exhibiting oedema after 10 μM VDR agonist treatment (dark grey stack). Oedema was seen in 55% of calcifediol; 20% of calcitriol; 50% of tacalcitol; and 40% of maxacalcitol‐treated larvae. Notably, calcitriol induced lethality in 20% of treated larvae (light grey stack) (n = 20). (B) Brightfield image representation of overall zebrafish larval morphology with 10 μM calcifediol, tacalcitol, maxacalcitol and calcitriol treatment. Larvae frequently presented with yolk sac (white arrow) and/or pericardial oedema (black arrow). Scale bar represents 500 μm. (C) A dose‐dependent decline in larval visual response (optokinetic) was found with calcitriol treatment. Scatter plot showing saccades min−1 per larva, one‐way ANOVA with Dunnett's post hoc test, asterisk signifies P ≤ 0.05, and group size as indicated, with n representing total number of larvae. (D) Toluidine blue stained larval ocular cross sections show an absence of gross morphological defects and the presence of retinal lamination in VDR agonist‐treated larvae between 2 and 5 dpf. Several larvae presented with pyknotic nuclei, indicated by yellow arrows (n = 3). Scale bar represents 50 μm. PRL, photoreceptor layer; INL, inner nuclear layer; ONL, outer nuclear layer; IPL, inner plexiform layer; L, lens; GCL, ganglion cell layer.
