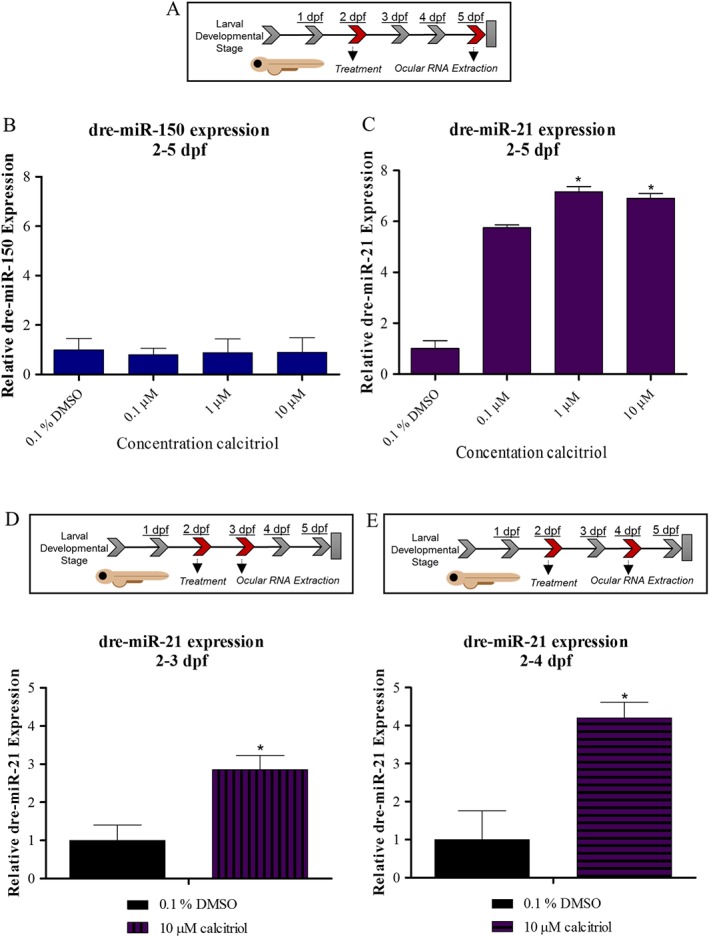
Figure 5.

Calcitriol regulates ocular dre‐miR‐21 expression in zebrafish larvae. (A) Expression of selected miRNA in zebrafish larval eyes was profiled following 0.1–10 μM calcitriol treatment from 2 to 5 dpf. (B) Ocular dre‐miR‐150 expression is unchanged by calcitriol treatment compared with 0.1% DMSO control. Graph showing mean fold change with ±SEM of treatment Ct, one‐way ANOVA with Dunnett's post hoc test analysis and n = 5 with each n representing eyes isolated from ~60 treated larvae. (C) Ocular dre‐miR‐21 expression is significantly up‐regulated by calcitriol treatment compared with 0.1% DMSO control. Graph showing mean fold change with ±SEM of treatment Ct, one‐way ANOVA with Dunnett's post hoc test analysis, asterisk denotes P ≤ 0.05 and n = 5 with each n representing eyes isolated from ~60 treated larvae. (D) Expression of dre‐miR‐21 in zebrafish larval eyes was profiled after 10 μM calcitriol treatment from 2 to 3 dpf. Ocular dre‐miR‐21 expression is significantly up‐regulated by calcitriol treatment compared with 0.1% DMSO control. Graph showing mean fold change with ±SEM of treatment Ct, unpaired t‐test analysis, asterisk denotes P ≤ 0.05 and n = 5, with each n representing eyes isolated from ~60 treated larvae. (E) Expression of dre‐miR‐21 in zebrafish larval eyes was profiled after 10 μM calcitriol treatment from 2 to 4 dpf. Ocular dre‐miR‐21 expression is significantly up‐regulated by calcitriol treatment compared with 0.1% DMSO control. Graph showing mean fold change with ±SEM of treatment Ct, unpaired t‐test analysis, asterisks denote P ≤ 0.05 and n = 5 with each n representing eyes isolated from ~60 treated larvae.
