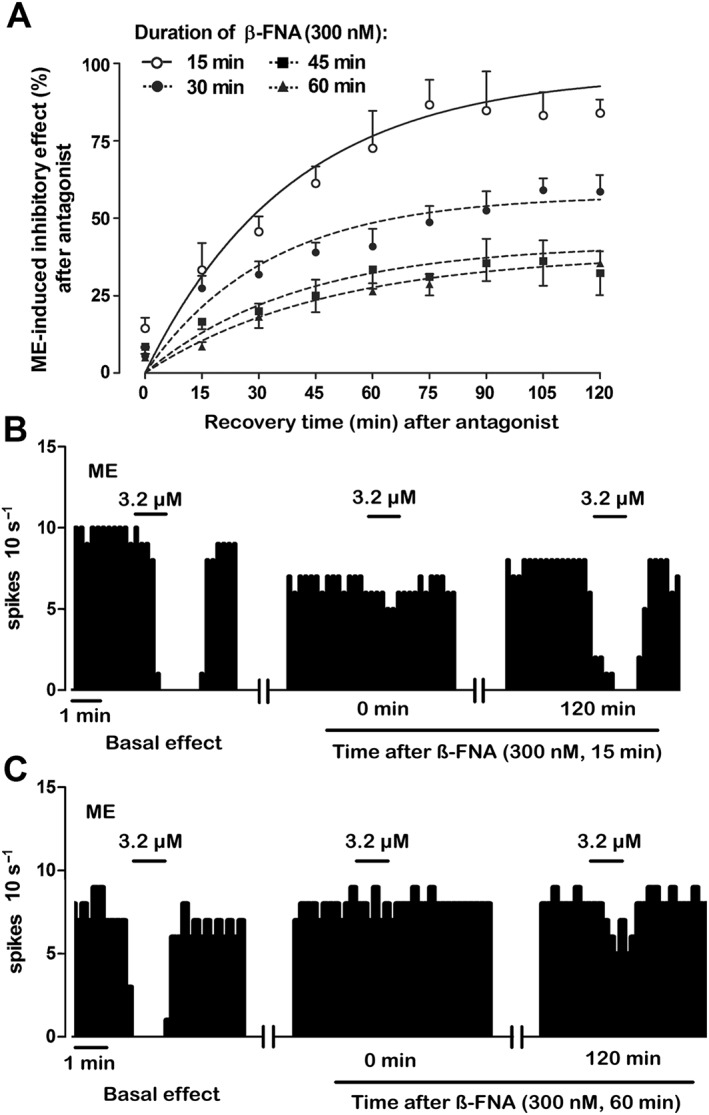
Figure 3.

Recovery of the inhibitory effect of ME (3.2 μM, 1 min) following perfusion with the irreversible μ receptor antagonist β‐FNA (300 nM) for different time periods. (A) Symbols represent the mean ± SEM of the percentage of ME‐induced inhibitory effect after β‐FNA perfusion. The horizontal axis represents the time after the end of antagonist application. The vertical axis indicates the inhibitory effect of ME (3.2 μM, 1 min) expressed as a percentage of the initial FR. The lines represent the theoretical curves constructed from the average of the recovery kinetic parameters that define the functional turnover of μ receptors (Table 2). Note that ME effect after 15 min of β‐FNA perfusion (n = 6) at t = 120 min is higher than that obtained after 30 min (n = 8), 45 min (n = 5) or 60 min (n = 5) of β‐FNA administration at t = 120 min. (B, C) Representative examples of FR recordings of LC neurons showing the recovery of ME‐induced inhibitory effect (3.2 μM, 1 min) after complete inactivation of μ receptors with β‐FNA (300 nM, 15 min) (B) and β‐FNA (300 nM, 60 min) (C). Vertical lines represent the number of spikes recorded every 10 s and the horizontal bars the period of drug application. Note that the inhibitory effect of ME is almost blocked 15 min after β‐FNA administration in both recordings in comparison with the control inhibitory effect. The inhibitory effect of ME completely recovers in the neuron receiving β‐FNA (300 nM, 15 min) but not in the neuron perfused with β‐FNA (300 nM, 60 min).
