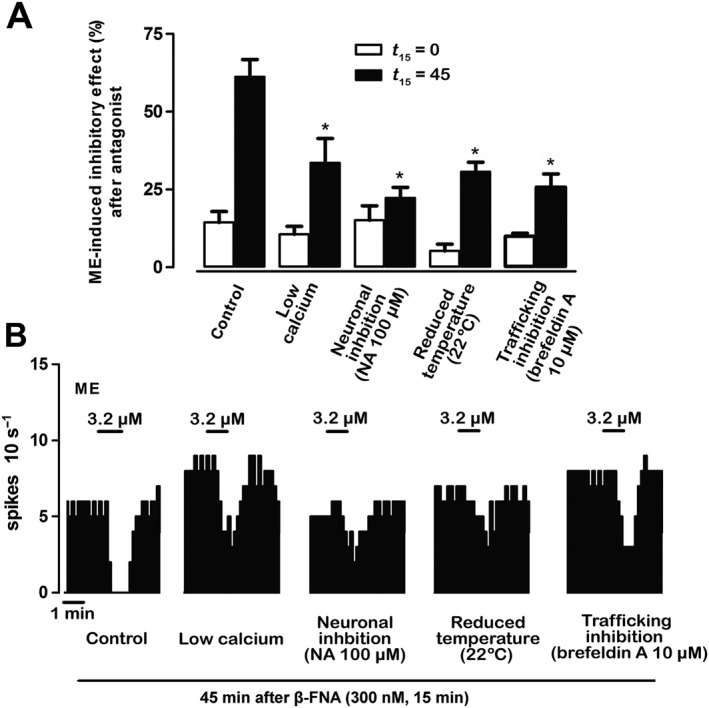
Figure 5.

Intracellular mechanisms of the functional turnover of μ receptors. (A) Bar histograms show the mean ± SEM of the percentage of ME‐induced effect immediately (t 15 = 0) and 45 min after 15 min (t 15 = 45) of β‐FNA (300 nM, 15 min) perfusion in different experimental conditions: control (n = 6), in the presence of low‐calcium aCSF (n = 6), during neuronal inhibition by NA (100 μM) (n = 6), at low temperature (n = 5) or during trafficking inhibition by brefeldin A (10 μM) (n = 5). *P < 0.05, compared with the corresponding control by a one‐way ANOVA followed by Bonferroni's post hoc test. (B) Representative examples of FR recordings of five LC neurons showing the recovery of ME (3.2 μM, 1 min)‐induced inhibitory effect 45 min after β‐FNA (300 nM, 15 min) application in different experimental conditions. Vertical lines represent the number of spikes recorded every 10 s and the horizontal bars the period of drug application. Note that the inhibitory effect of ME recovers 45 min after β‐FNA administration only in the control group.
