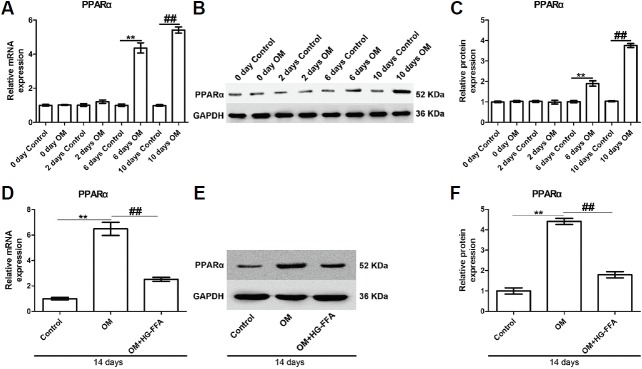
Fig. 1.
HG-FFA treatment markedly down-regulates PPARα expression induced by OM.
(A–C) PPARα expression gradually increased along with induction time and peaked at day 14. The significant up-regulation appeared at day 6 after osteogenic induction. (D–F) At day 14, HG-FFA treatment decreased PPARα expression significantly. (A, D) Quantitative PCR results. (B, E) Western blot bands. (C, F) The densitometry analysis of protein bands. Quantitative PCR and Western blot were performed 0, 2, 6, 10, and 14 days after osteogenic induction and HG-FFA treatment. **and ## indicate P < 0.01. N = 3.

