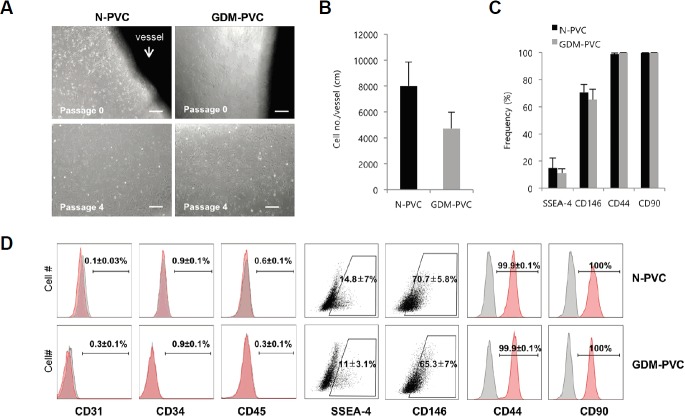
Fig. 1.
Isolation and phenotypic characterization of HUCPVCs.
(A) Bright field images of HUCPVCs obtained from healthy and GDM patients. Arrow indicates dissected vessel from HUC. Scale bars. 500 μm. (B) Average number of harvested PVCs per centimeter of vessel length. (C, D) Representative flow cytometry dot plots and histograms for comparing phenotypes between N-PVCs and GDM-PVCs. Frequencies indicate average and SD. Error bars indicate SD.

