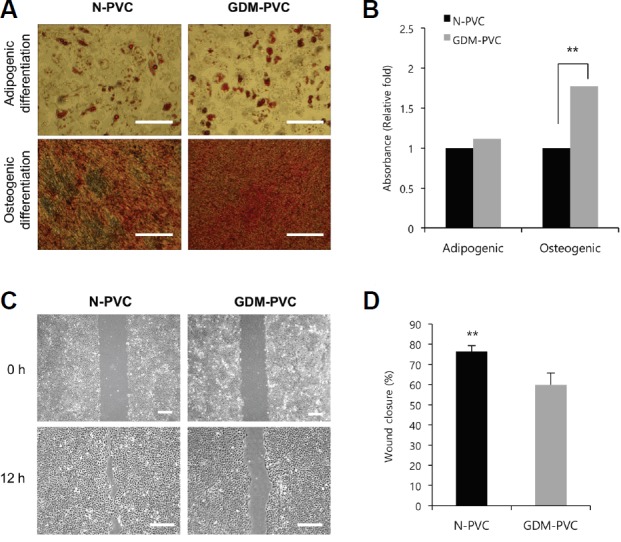
Fig. 4.

Comparison of in vitro regeneration potential between N-PVCs and GDM-PVCs.
(A) Representative images of Oil Red O and Alizarin Red S staining for adipocytes and osteocytes. Scale bars. 500 μm. (B) Measurements of Oil Red O and Alizarin Red S contents using spectrophotometry. (C) Representative images were captured by microscope and analyzed using ImageJ software at 0 and 12 h. Scale bars. 500 μm. (D) Percentage of uncovered wound area from BEAS-2B cell monolayers treated with N-PVC-CM and GDM-PVC-CM for 12 h. **p < 0.01. Error bars indicate SD.
