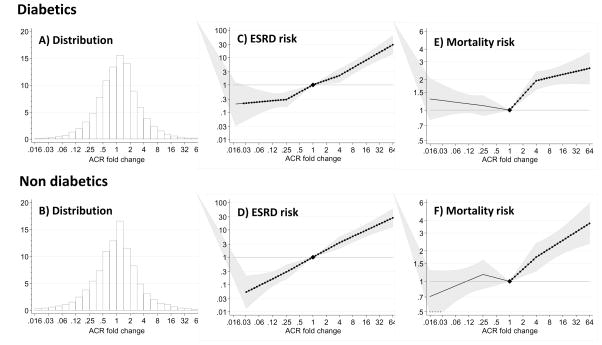
Figure 2.
Distribution of 2-year ACR fold changes (Panels A and B) and adjusted hazard ratio of end-stage renal disease (ESRD, Panels C and D) and mortality (Panels E and F) associated with a 2-year fold change in ACR stratified by the presence of diabetes mellitus. Adjusted for baseline (log) ACR, baseline eGFR (knot at 60 ml/min/1.73 m2), age, gender, total cholesterol, hypertension and history of cardiovascular disease. Median ACR (IQR) was 19 (7, 106) mg/g in non-diabetics and 16 (7, 60) mg/g in diabetics. Filled circles denote statistical significance (P<.05) compared with the reference (diamond) at stable ACR (1-fold change). Grey area represents 95% confidence intervals. P value for the product diabetes x ACR fold change >0.1.

