Figure 2.
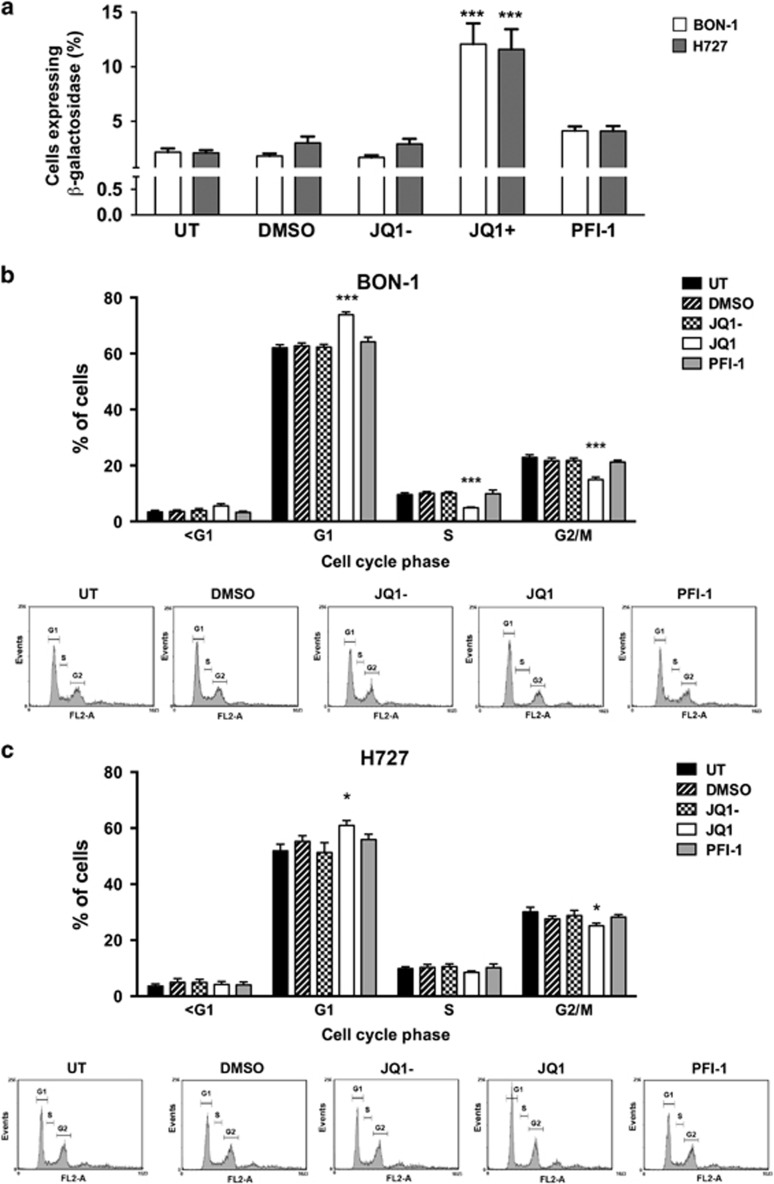
Effect of BET protein inhibition on cell cycle progression of NET cells. BON-1 and H727 cells were treated with a single dose of 1 μM JQ1 or PFI-1 compounds, and untreated (UT), vehicle only (DMSO) and JQ1- (a negative stereoisomer of JQ1) were used as negative controls. (a) The level of cellular senescence was measured, 96 h after compound treatment by determining the percentage of cells staining positively for β-glalactosidase. BON-1 cells are represented by white bars and H727 by grey bars. BON-1 (b) and H727 (c) cell cycle profiles were analysed after 48 h compound treatment using propidium iodide staining and flow cytometry. UT is represented by black bars, DMSO represented by bars with diagonal lines, JQ1- represented by chequered bars, JQ1 by white bars and PFI-1 treatment by grey bars. Gating for cell cycle stages is indicated on the histograms, with cells with lower fluorescence than the G1 gate classified as <G1. All experiments were performed in n=4, with 4 technical replicates per experiment, with statistical significance relative to DMSO control assessed using a one-way ANOVA *P<0.05; ***P<0.0005.

