Figure 1.
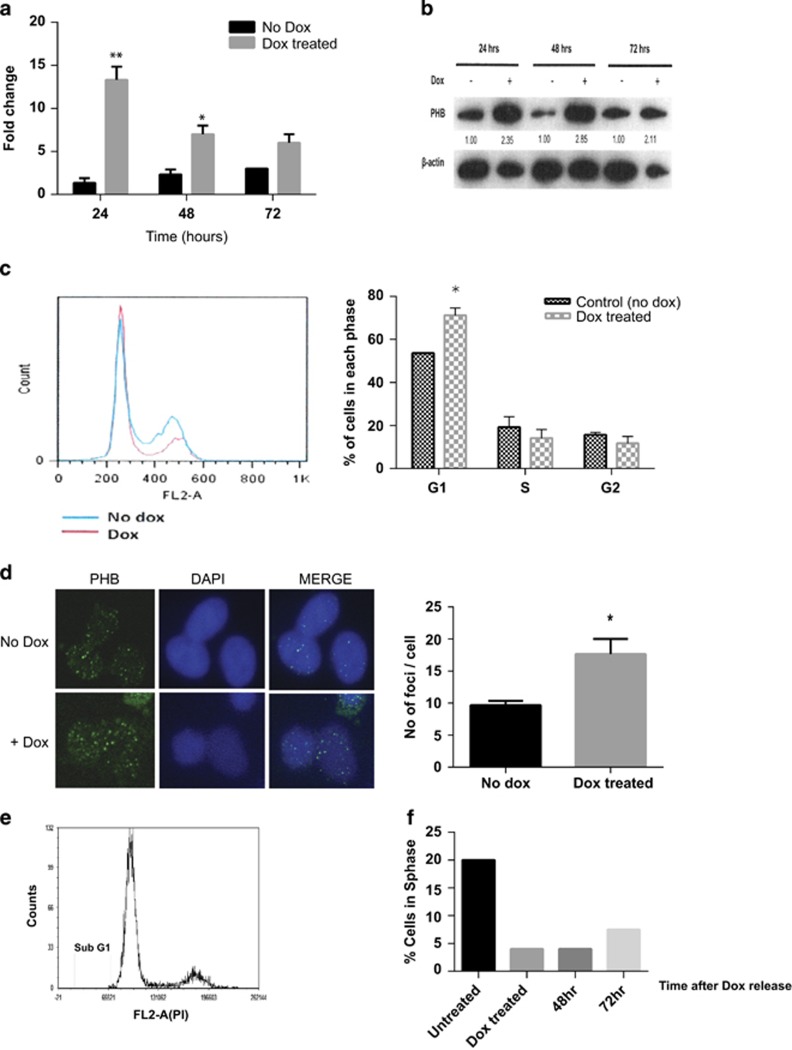
Doxycycline-induced PHB cDNA expression inhibits cell cycle entry. (a) Q-PCR expression analysis of PHB transcript expression from LNCaP/PHBcDNA cells treated±doxycycline for 24–72 h, as normalised to β-actin, GAPDH and RPL19 housekeeping genes. (b) Western blot of PHB and β-actin expression in LNCaP/PHBcDNA cells treated±doxycycline for 24–72 h. Densitometry data for each blot are given underneath. (c) FACS analysis of LNCaP/PHBcDNA cells treated±doxycycline. Left-hand side represents overlaid histograms of DNA content as measured by propidium iodide fluorescence. Right-hand side shows a bar chart indicating the cell cycle distribution of LNCaP/PHBcDNA cells treated±doxycycline. (d) Immunofluorescent staining of PHB expression and localisation in LNCaP/PHBcDNA cells±doxycycline for 24 h (FITC detection), also DNA (DAPI). Associated bar chart represents number of foci per cell nucleus of LNCaP/PHBcDNA cells treated±doxycycline for 24 h (from an average cell count of 100). (e) Cell cycle distribution of LNCaP/PHBcDNA cells±doxycycline for 24 h, and washed and released and allowed to grow for 72 h. Cells show no sub-G1 apoptotic population. (f) Bar graph showing % of LNCaP/PHBcDNA cells re-entering the S phase 72 h after doxycycline removal from the medium. All data are the mean±s.d. of three independent experiments performed in triplicate. *P<0.05 and **P<0.01 (t-test analysis).

