Figure 3.
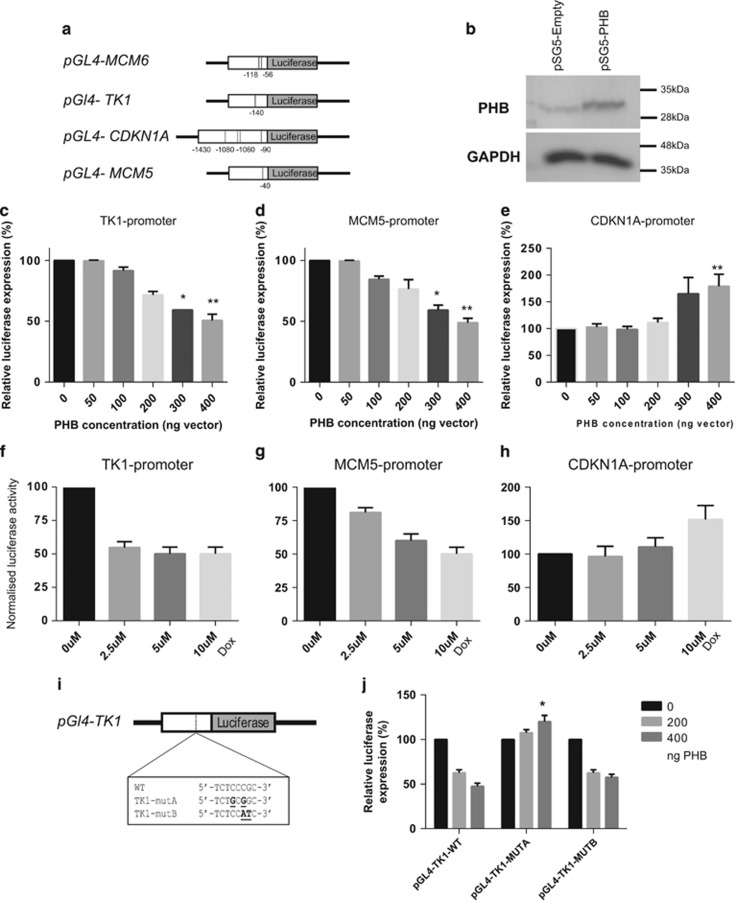
PHB represses MCM5 and 6, and TK1 promoters, while activating the CDKN1A promoter. (a) Schematic diagram of the promoter-reporter fusion plasmids generated linked to luciferase. The proximal gene promoter of 500–1000 bp cloned upstream of luciferase. Numbered lines indicate the position of predicted strong E2F1 binding sites (ALGGEN software). (b) Western blot analysis of PHB expression levels from COS-7 cells transfected with pSG5-PHB or empty vector (pSG5). (c–e) Luciferase activity in COS-7 cells transfected with TK1 promoter (c), MCM5 promotor (d) and CDKN1A (p21) promoter (e) in the presence of increasing amounts of pSG-PHB vector (0–400 ng) or empty vector control. Data were normalised to β-galactosidase activity. (f–h) Luciferase activity in LNCaP/PHBcDNA cells treated with increasing doses of doxycycline and (f) TK1 promoter, (g) MCM5 promoter and (h) CDKN1A promoter. (i) Schematic diagram of the TK1 gene promoter indicating the E2F1 binding site and the sequences in the TK1 mutant promoters generated. (j) Luciferase activity in COS-7 cells transfected with TK1 and mutant TK1 promoter reporters with increasing amounts of pSG-PHB vector (0–400 ng) or empty vector. All data are the mean±s.d. of three independent experiments performed in triplicate. *P<0.05 and **P<0.01 (t-test analysis).

