Figure 2.
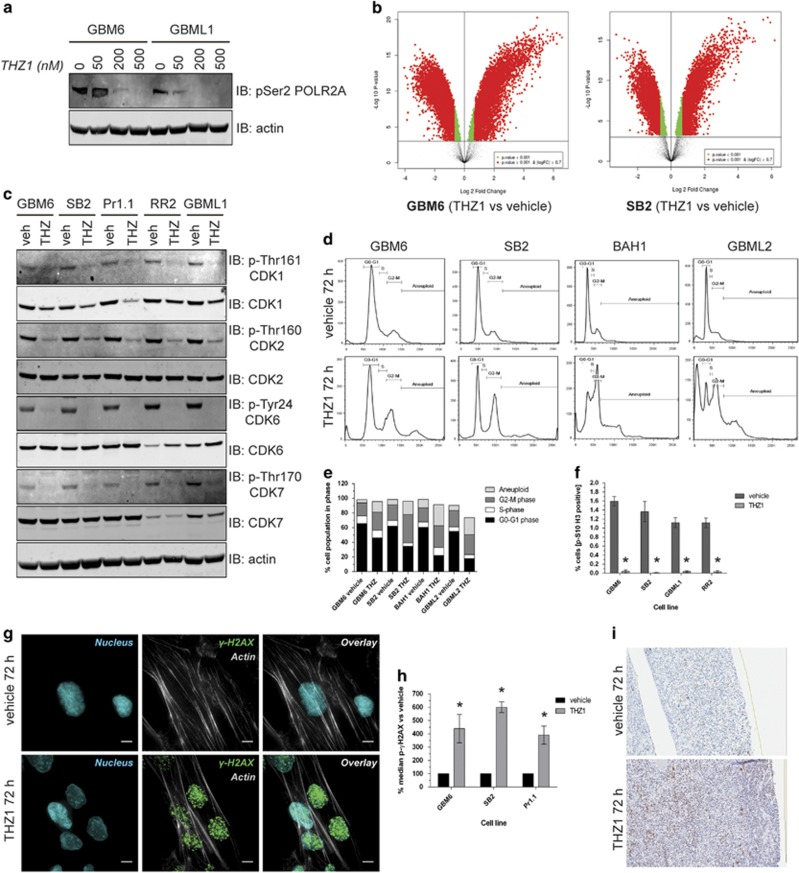
THZ1 perturbs the transcriptome and cell cycle, causing mitotic arrest at G2 phase and DNA damage. (a) Lysates from cells treated with increasing doses of THZ1 for 48 h analyzed for pSer2 POL2RA (top panel) by western blotting, with actin used as a loading control (bottom panel). (b) Volcano plots of microarray data documenting the differential expression of genes in THZ1-treated cells vs vehicle-treated cells in GBM6 (top graph) and SB2 (bottom graph). Data are presented as a log2 fold change in gene expression against the log10 P-value statistical probability of this change. Changes of log2 >0.7 with a P-value<0.001 are depicted in red, whereas changes of log2 <0.7 with a P-value<0.001 are depicted in green. Genes displaying no significant differential expression are depicted in black. (c) Lysates from cells treated with vehicle or 200 nM THZ1 for 48 h analyzed for the activation status of multiple CDKs as indicated to the right of panels by western blotting. (d) Histograms of four neurosphere lines permeabilized and stained with propidium iodide after 72-h treatment with vehicle or 200 nM THZ1. The cell cycle phases G0–G1, S, G2–M and aneuploidy are marked. (e) Graphical representation of the percentage of cells in each cell cycle phase after 72 h of vehicle or 200 nM THZ1 treatment across four primary cell lines. Data are presented as the percentage of the total cell population in each cell cycle phase. (f) Quantification of pSer10-Histone 3 staining by flow cytometry for primary cells treated with vehicle or 200 nM THZ1 for 24 h. Data are represented as the percentage of the total cell population staining positive for pSer10-Histone 3±s.e.m. Vehicle vs THZ1 *P<0.05 by two-way analysis of variance (ANOVA), d.f.=14. (g) Representative immunofluorescent z-stack images of SB2 cells treated with vehicle or 200 nM THZ1 for 72 h and stained for actin (gray), pSer139 γH2AX (green) or nucleus (blue). Scale bar: 10 μm. (h) Quantification of pSer139 γH2AX staining in primary cell lines treated with vehicle or 200 nM THZ1 for 72 h. Data are presented as the median pSer132 γH2AX signal for the cell population vs vehicle controls±s.e.m. Vehicle vs THZ1 *P<0.05 by multiple t-test analysis with Holm–Sidak correction, d.f.=4. (i) Ex vivo patient HGG tissue slices treated with vehicle or 200 nM THZ1 for 72 h before immunohistochemical staining for pSer139 γH2AX (brown) and counterstaining for nuclei (blue). All experiments were repeated a minimum of two times over multiple primary cell lines.

