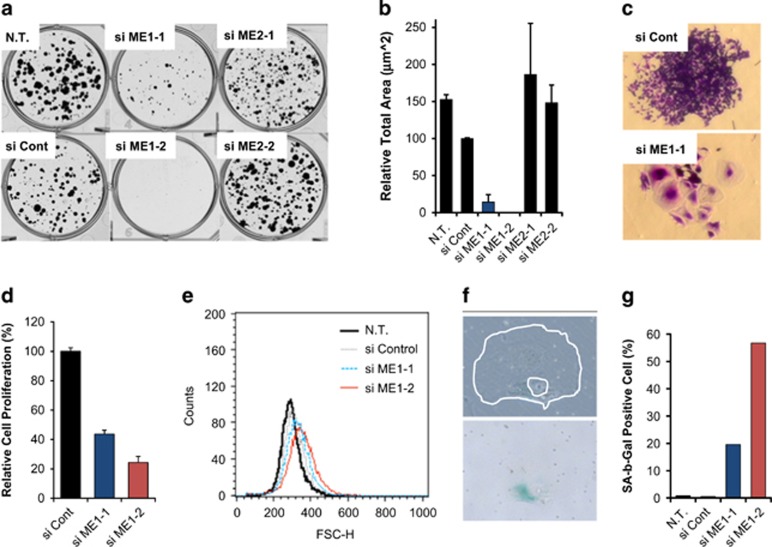
Figure 2.
ME1 knockdown induces cellular senescence and suppresses cell growth. (a,b) HCT116 cells were reversely transfected with control, ME1, or ME2 siRNAs and 1000 cells were seeded on six-well plates. Then, cells were cultured for 11 days for colony formation assay. Colonies were fixed and stained with Crystal violet, and colony area of each well was quantified by GelCount and relative total area is shown as a bar graph (n=3, mean with s.d.). (c) Light microscopy images of colonies of HCT116 cells transfected with si control and si ME1-1. (d) PC3 cells were transfected with ME1 siRNAs and viability was determined 96 h after transfection. Relative cell proliferation is shown as a bar graph (n=3, mean with s.d.). (e) PC3 cells were transfected with ME1 siRNAs and cultured for 96 h. Cell size forward scatter (FSC) was detected by FACS analysis. (f) PC3 cells were transfected with ME1 siRNAs for 9 days and β-galactosidase was then stained. Cell (outer white line) and its nucleus (inner white line) are shown in the upper photograph. β-galactosidase was stained in blue and is shown in the lower photograph. (g) β-galactosidase-positive cells were manually counted and the percentage of stain-positive (SA-b-Gal positive) cells are shown in the bar graph. FACS, fluorescence-activated cell sorting.

