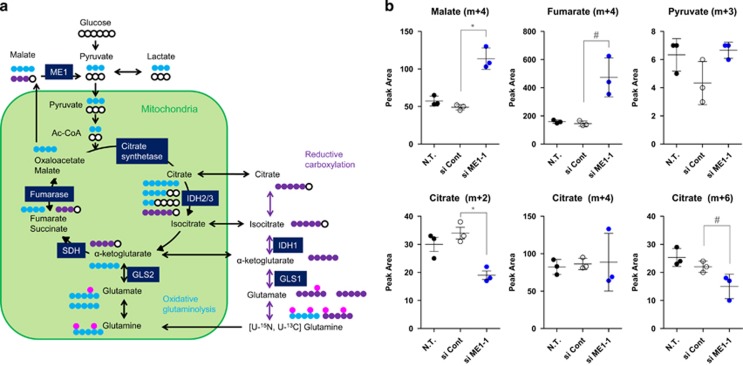
Figure 3.
[U-13C, U-15N] l-glutamine isotope profiling analysis revealed malate metabolism is suppressed by si ME-1. (a) Schematic representation of glutamine isotope profiling. Blue and purple circles indicate a carbon isotope, metabolized through oxidative glutaminolysis and reductive carboxylation, respectively, pink circles a nitrogen isotope and white circles non-labelled carbons. (b) [U-13C, U-15N] l-glutamine profiling analysis was performed in the HCT116 cell line. Cells were cultured for 72 h after siRNA transfection and labelled for 24 h in McCoy's 5A media with 2 mm [U-13C, U-15N] l-glutamine. Cell pellets were then collected for flux analysis. Peak area of each metabolite is shown in the dot graph (n=3, t-test; *P<0.01; #P<0.05).

