Figure 3.

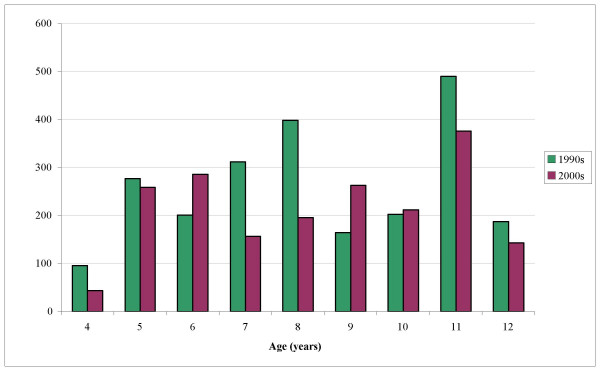
Histogram of the number of children in each age group for data from the current study (2000s) and the previously reported early 1990s data [30].

Histogram of the number of children in each age group for data from the current study (2000s) and the previously reported early 1990s data [30].