Figure 1.
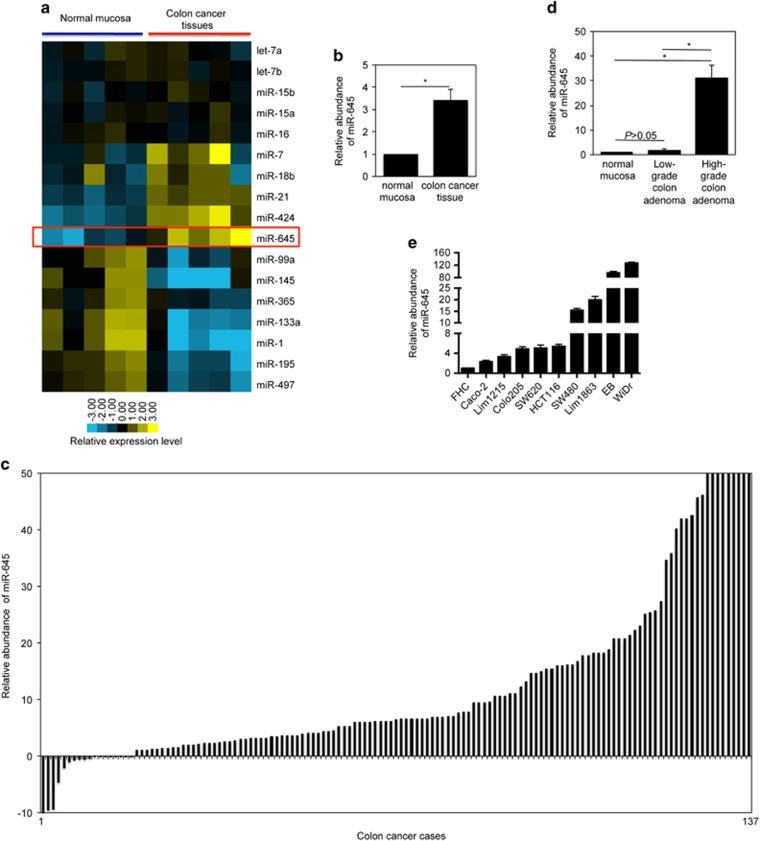
MiR-645 is upregulated in CRC cells. (a) MiR expression of 5 CRC tissues and corresponding control tissues by microarray analysis. Unsupervised hierarchical clustering was used for the array data analysis. (b) Quantitation of the microarray data showing that miR-645 is upregulated in CRC tissues. The data are presented as average fold changes of miR-645 level in CRC tissues normalized to their corresponding controls. *P<0.05, Student's t-test. (c) qPCR analysis showing that miR-645 is upregulated in the majority of colon cancers. The data shown are fold changes of miR-645 expression in CRC cases normalized to paired normal adjacent tissues. (d) qPCR analysis of miR-645 in high-grade colon adenomas, low-grade or normal colon epithelial tissues. The relative abundance of miR-645 in normal mucosa was arbitrarily designated as 1. mean±s.e., n=3. *P<0.05, Student's t-test. (e) qPCR analysis of miR-645 in cultured CRC cell lines and the FHC cells. The relative abundance of miR-645 in FHC cells was arbitrarily designated as 1. mean±s.e., n=3.

