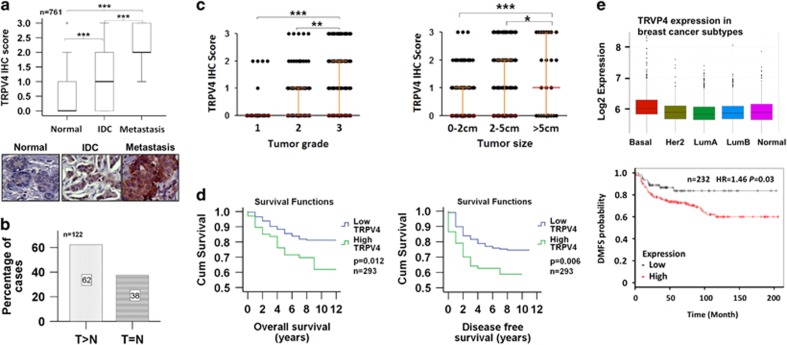
Figure 1.
TRPV4 expression in clinical breast cancers. (a) Box plot of TRPV4 expression in normal, IDC and metastasis lesions. Statistical significance was calculated using Mann–Whitney U test. Representative images are shown at × 400 magnification. (b) Bar chart showing the percentages of cases of paired IDC tissues and adjacent normal breast tissues with the indicated trends. Statistical significance was calculated using Mann–Whitney U test (n=122). (c) Dot plots showing the correlation of TRPV4 expression with tumor grade and size. Statistical significance for the bar charts was calculated using Mann–Whitney U test. (d) Kaplan–Meier Analysis of TRPV4 expression with OS and disease-free survival. Statistical significance was estimated using log-rank test. (e) Clinical significance of TRPV4 overexpression. Upper: the box plot of TRPV4 gene expression across tumor subtypes using GENEANALYTICS. Lower: correlation of TRPV4 expression with DMFS using KMplotter on a total of 232 basal subtype breast cancers.

