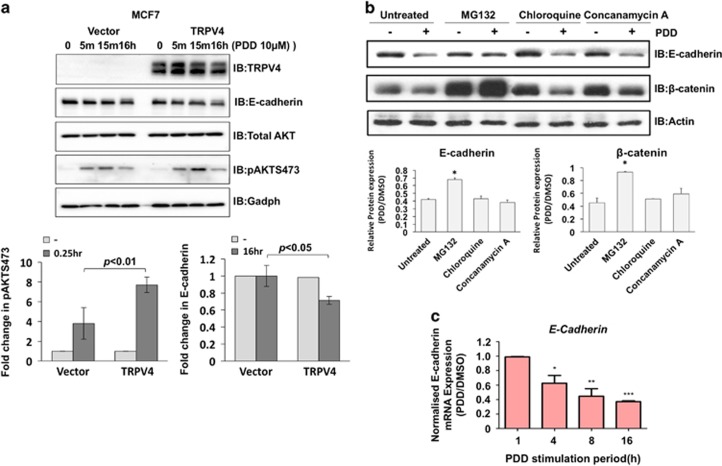
Figure 6.
TRPV4 activation induced E-cadherin downregulation through a combination of transcriptional and post-translational mechanism. (a) MCF7 cell line was transiently transduced with vector control or TRPV4-expressing retrovirus. Cells were treated with PDD at indicated time points. Cell lysates were then Western blotted with the indicated antibodies (top panel). Following densitometry, relative expression of pAKT and E-cadherin were normalized with total AKT and Gadph, respectively, and plotted as bar charts (bottom panels). (b) Cells were pre-treated for 1 h with proteasomal inhibitor MG132 (10 μm), lysosomal inhibitors chloroquine (100 μm) or concanamycin A (100 nm) before treatment with 4α-PDD or DMSO. Lysates were then immunoblotted with the indicated antibodies. Bar charts are the densitometry of pAKT and E-cadherin protein expression levels. Relative expression of pAKT and E-cahderin were normalized with total AKT and Gadph, respectively. Error bars show mean±s.e.m. (n=3). (c) The mRNA expression of E-cadherin in 4T07 cells upon different durations of 4α-PDD stimulation was examined using real-time PCR. Error bars show mean±s.e.m.

