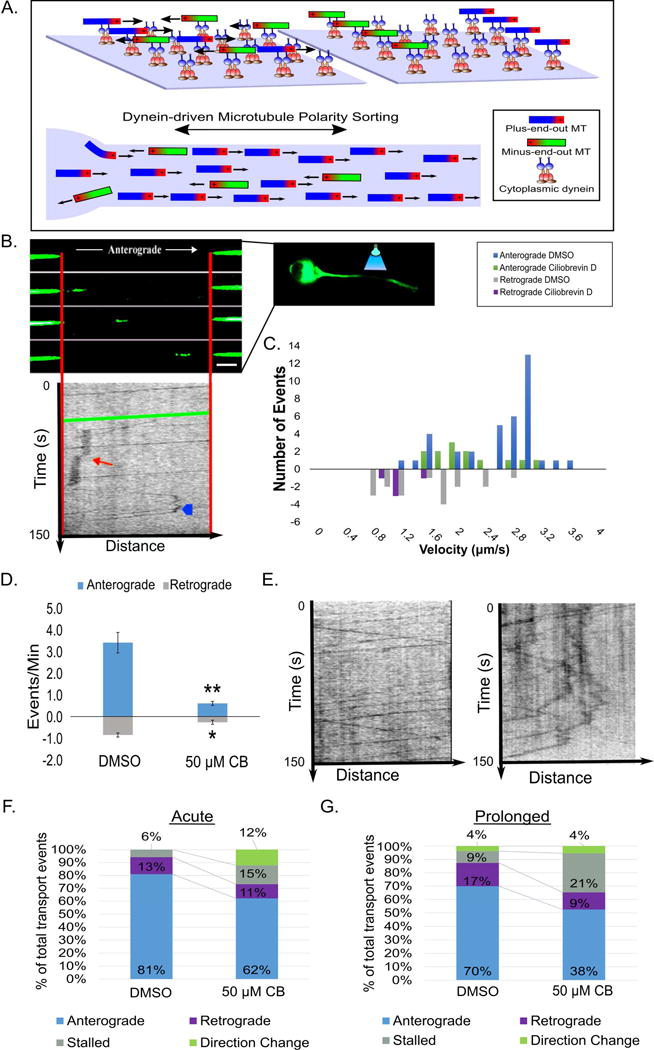
Figure 3. CB disrupts MT transport.

A. Schematic depicting how dynein’s MT polarity-sorting ability on glass coverslips (top) is proposed to sort MTs in the axon (bottom). B. A representative image of a MT moving through a bleached region of an axon of a neuron expressing tdEos-tubulin under control conditions (top; scale bar, 5 μm) with an affiliated kymograph (plots position over time [150 s]; middle). The green line represents the movement of the pictured MT. The red arrow shows a stall event and the blue arrowhead depicts a MT reversal. C. Frequency histogram showing anterograde and retrograde transport events under DMSO and CB conditions. D. Bar graph showing the MT transport events per min. after CB. E. Kymographs (left: control; right: CB) plotting MT transport events over time (150 s). F. and G. 100% stacked histogram of types of transport events after acute and prolonged inhibition. n=25 neurons per condition from 3 independent dissections. * - p<0.05; ** - p <0.01; *** p <0.001
