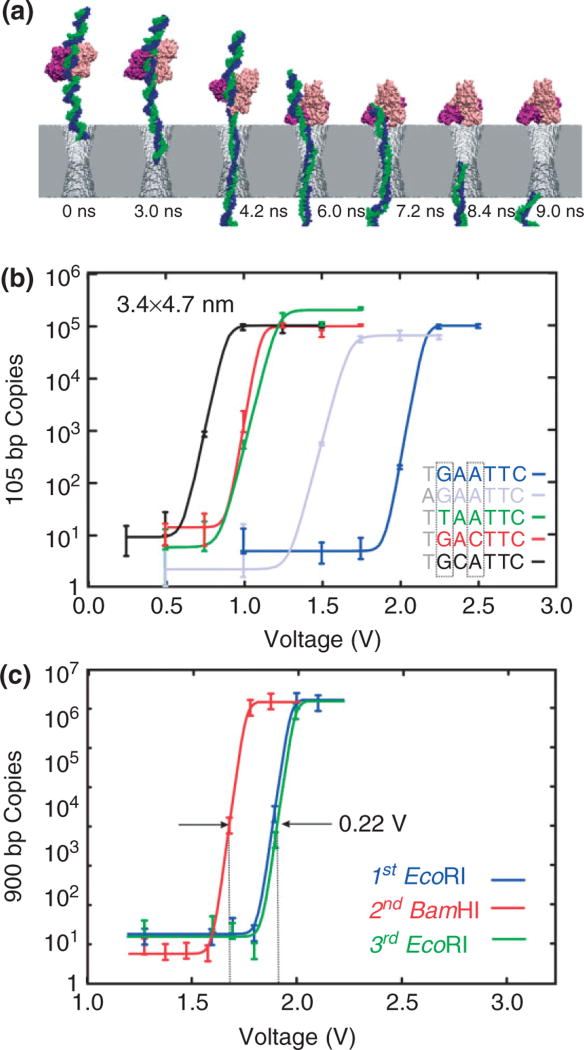
FIGURE 3.
Voltage threshold for permeation through a solid-state nanopore depends on the sequence. (a) Molecular dynamics simulations of EcoRI—DNA complex encountering synthetic nanopore. Snapshots illustrating simulated dissociation of an EcoRI–DNA complex due to the electric field in a nanopore. The Si3N4 membrane is shown in gray, two strands of DNA in blue and green, a protein dimer in pink and purple, water and ions are not shown. Time elapsed from the moment a 4-V transmembrane bias was applied as indicated. (b) Quantitative PCR (qPCR) results indicating the number of 105 base pair (bp) copies from EcoRI–DNA that permeates a 3.4 × 4.7 nm pore with a threshold voltage that depends on the DNA sequence. Superimposed on the data are fits to the curve used to determine the threshold. The cognate sequence GAATTC (blue) has a threshold voltage of about 2.1 V, but in contrast, with a substitution for the first base, TAATTC (green) has a threshold of only 1.1 V. (c) qPCR results indicating the number of 900 bp DNA copies from either EcoRI–DNA or BamHI–DNA that permeates a pore depends on the enzyme. The inset shows a transmission electron micrograph of the 3.4 × 4.5 nm pore. The threshold for the EcoRI and BamHI rupture scales with the bulk dissociation energies.

