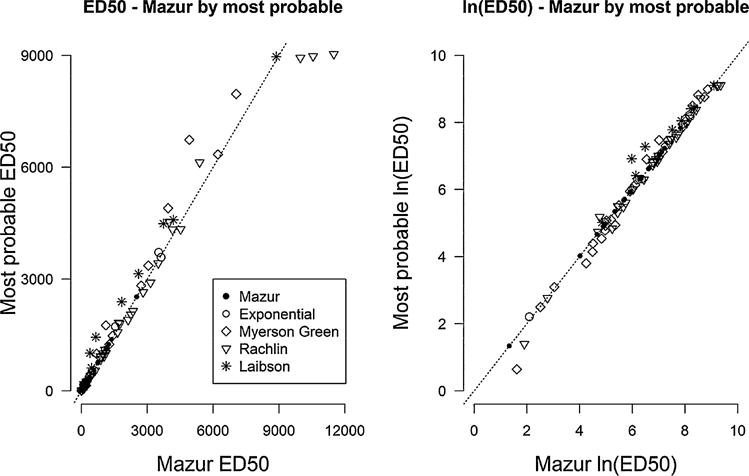
Fig. 2.

Concordance between Mazur and most probable ED50 estimates by selected model. Left panel shows ED50 values and right panel shows ln(ED50) values. Spearman correlation between these values was 0.99 in both cases. The dashed line is the 45 degree X=Y line. Despite high correlation, ED50 estimates vary between Mazur and most probable approach for several individual participants.
