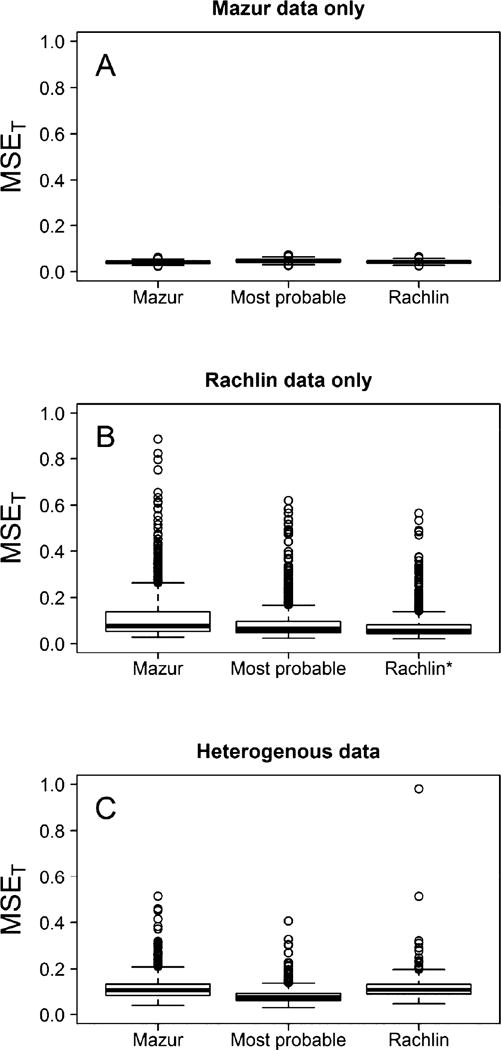
Fig. 4.

MSET values comparing the estimated ln(ED50) to the true value of ln(ED50) used in the simulation. Panels A, B, and C correspond to data that arise from the Mazur only, Rachlin only, and heterogeneous settings. In the heterogeneous setting, MSET is lowest when model selection is used, indicating that if the multiple model hypothesis is correct, then the model selection approach more accurately estimates ED50. * indicates that two points are above the plotted vertical range.
