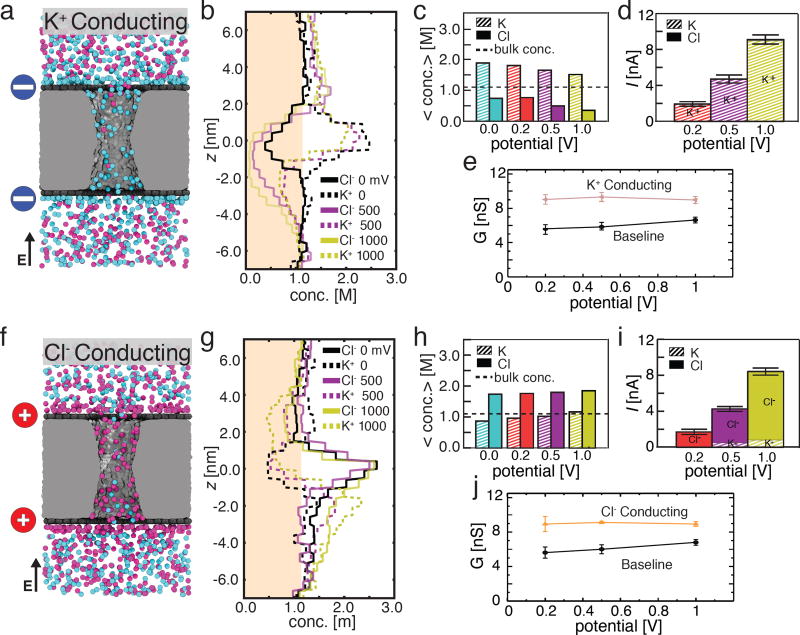
Figure 3.
Selective ionic transport in charged nanopore capacitor systems. (a) Representative configuration of ions in a nanopore capacitor system that has both graphene plates negatively charged to σbottom = σtop = −2.0 e nm−2. The particular molecular configuration shown corresponds to a transmembrane bias of 200 mV. Blue circles schematically indicate the negative charge of the graphene plates. (b) The average concentration of Cl− (solid) and K+ (dashed) ions along the pore axis at 0 mV (black), 500 mV (purple), and 1 V (yellow) transmembrane bias (the profiles at 200 mV are omitted for clarity). The shaded region indicates a concentration below the bulk concentration of 1.1 M. (c) The total average concentration of K+ (striped) and Cl− (solid) ions inside the nanopore at transmembrane biases of 0 mV (blue), 200 mV (red), 500 mV (purple), and 1000 mV (yellow). The average concentrations and the concentration profiles were obtained as described in the caption to Figure 2c,d. (d) The average ionic current (total height of each bar) and the currents carried by K+ (striped) and Cl− (solid) species at 200 mV (red), 500 mV (purple), and 1 V (yellow) transmembrane bias. Error bars indicate the standard error of the mean. (e) The simulated conductance of the positively charged nanopore capacitor versus the transmembrane bias. Data for the baseline (uncharged) capacitor are shown for comparison. (f–j). Same as panels a–e but for the nanopore capacitor system that has both graphene plates positively charged to σbottom = σtop = +2.0 e nm−2. Red circles schematically indicate the positive charge of the graphene plates.

