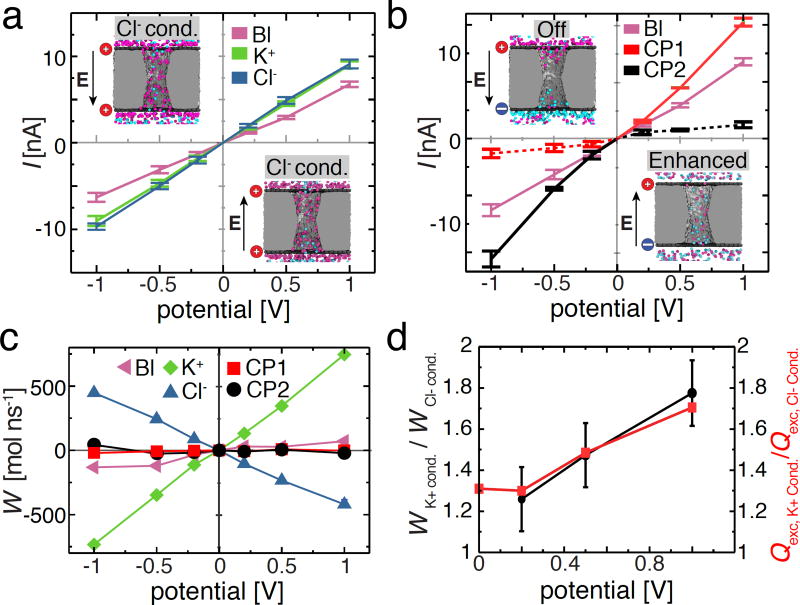
Figure 5.
Rectification of ion and water flux by a charged nanopore capacitor. (a) Current–voltage dependence of the neutral (baseline, labeled as ‘Bl’, magenta), negatively charged (K+ conducting, green), and positively charged (Cl− conducting, blue) nanopore capacitor system. The embedded images illustrate two representative configurations of ions inside the positively charged nanopore capacitor system (σtop = σbottom = 2.0 e nm−2) for the two polarities of the 200 mV transmembrane bias. (b) Current voltage dependence of the electrically neutral nanopore capacitor system for the following three charge states of the plates: both plates are neutral (baseline, magenta, same as in panel a), σtop = +2.0 e nm−2 and σbottom = −2.0 e nm−2(CP1, red) and σtop = −2.0 e nm−2 and σbottom = +2.0 e nm−2, (CP2, black). The dashed and solid red or black lines indicate the Off and Enhanced conductance states of the nanopore capacitor, respectively. The embedded images illustrate two representative configurations of ions inside the CP1 system for the two polarities of the 200 mV transmembrane bias. (c) Water flux, W, through the nanopore capacitor systems for the five charge states of the capacitor’s plate. A positive water flux represents the net movement of water molecules from trans to cis chamber. The water flux was computed by summing up instantaneous displacements of water molecules within the nanopore volume, see Methods for details. (d) The ratio of the water flux magnitudes (left) or of the excess ion numbers (right) for the K+ conducting and Cl− conducting states. The excess number of ions, Qexc, was computed as the absolute magnitude of the charge of all ions confined within the |z| < 2.0 nm volume of the nanopore averaged over the last 15 ns of the respective MD trajectory.

