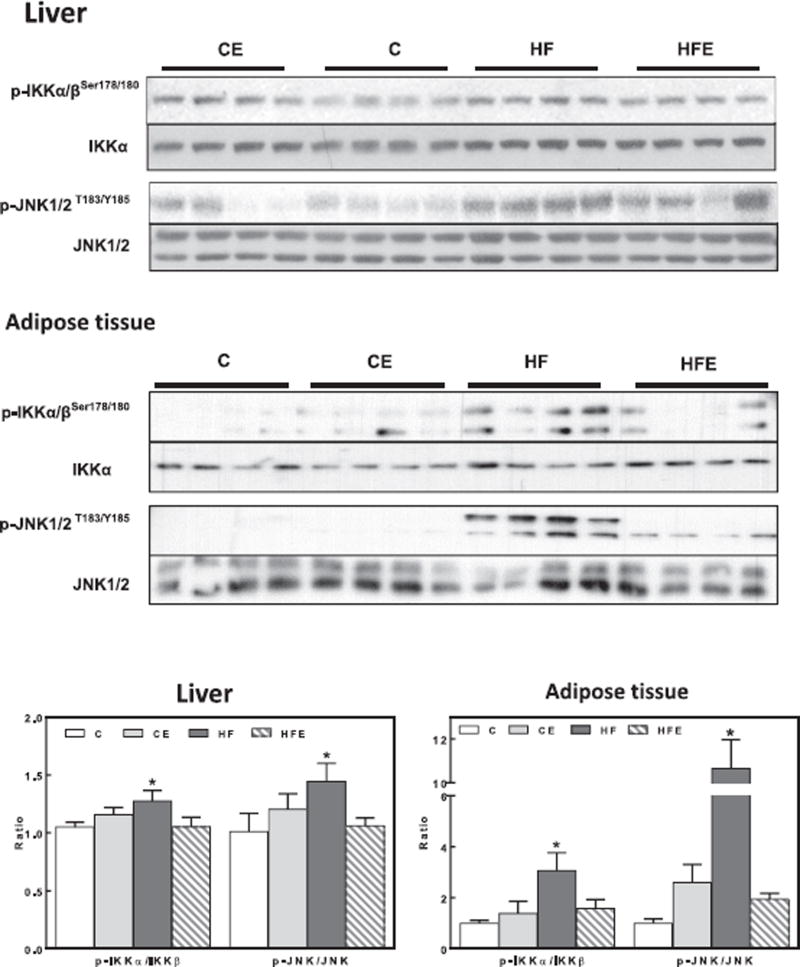
Fig. 5. Effects of EC supplementation on liver and epididymal adipose tissue inhibitory insulin signaling in HFD-fed mice: IKK and JNK.
Phosphorylation of IKKα/β (Ser178/180), JNK (Thr183, Tyr185) in liver and epididymal adipose tissue after 15 w on the corresponding diets. Bands were quantified and results for mice fed the control diet supplemented with EC (CE), the HFD (HF), and the HFD supplemented with EC (HFE) were referred to control group values (C). Representative immunoblots are shown. Bar charts represent pIKKαβ/IKKαβ and pJNK/JNK as means ± SEM from 9 to 10 animals/treatment. * significantly different from all other groups (p < 0.05, one way ANOVA test).

