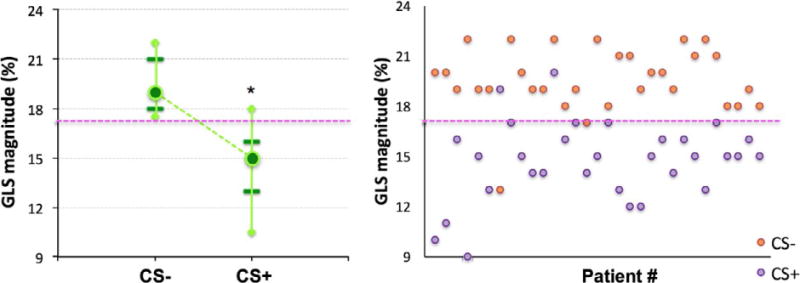
FIGURE 2.

Whisker plot summary (left) and individual patients’ data (right) of LV global longitudinal strain (GLS) magnitude obtained separately for the patients with and without cardiac sarcoidosis (CS+ and CS−, respectively). Median values (circles), 5th and 95th percentiles (diamonds), as well as 20th and 80th percentiles (horizontal lines) are shown. The 17% cutoff value that best separated the two groups is shown as a dashed horizontal line. *Statistically significant, P<0.05, between the two groups. See text for details
