Figure 1.

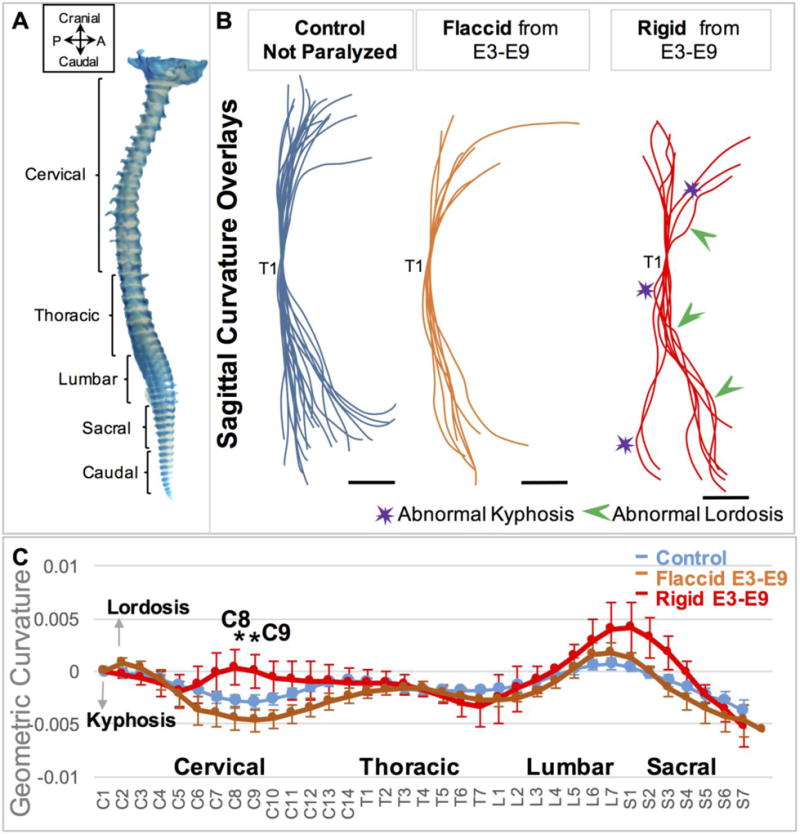
Rigid paralysis induced more severe abnormalities in curvature than flaccid paralysis. (A) E9 chick whole spine stained for cartilage. P; posterior, A; Anterior. (B) Overlays of curvatures in the sagittal plane of control spines (blue, n=21), prolonged flaccidly paralyzed spines (orange, n=7) and prolonged rigidly paralyzed spines (red, n=8), with all spines aligned to thoracic vertebra 1 (T1). Regions of pronounced abnormal lordosis (green arrows) and kyphosis (purple stars) are highlighted. Scale Bars 2000μm. (C) Geometric curvature (GC) analysis of flaccidly paralyzed spines (orange line, n=7), rigid paralyzed spines (red line, n=8) and control curves (blue line, n=21). Y-axis; 1/ radius of curvature, represented by arbitrary units of length. GC>0 lordotic curve, GC<0 kyphotic curve, GC=0 straight spine. X-axis; the craniocaudal individual vertebrae. Significant differences were identified between paralysis regimes at C8 and C9, * p≤0.05. C; cervical, T; thoracic, L; lumbar, S; sacral.
