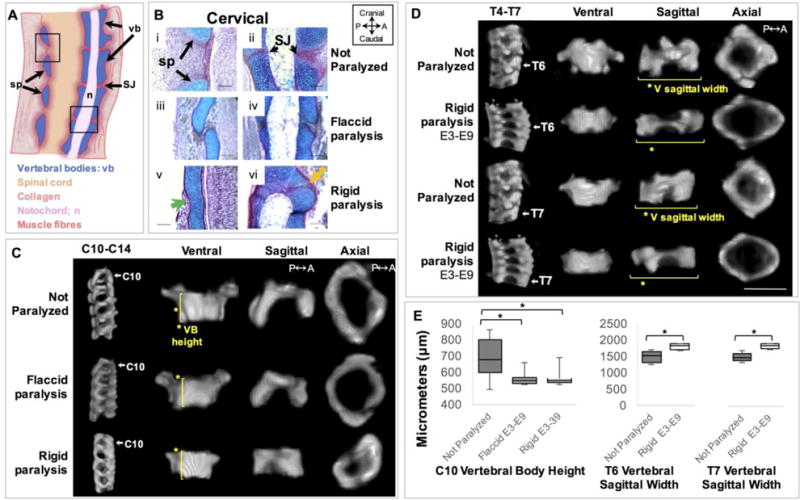
Figure 2.

Prolonged rigid paralysis induced vertebral cartilaginous fusion while both prolonged paralysis regimes led to a reduction in vertebral body height in C10. Prolonged rigid paralysis also led to a decrease in the vertebral sagittal width of T6 and T7. (A) Schematic of a normal sagittal cross section of a portion of the cervical region indicating clear separation of the spinous process (sp) and the symphysis joints (SJ). (B) Sagittal sections stained with alcian blue (for cartilage) and picrosirus red (for collagen) show posterior spinous process (i, iii, v) and anterior symphysis joints (ii, iv, vi) in control (i–ii), flaccidly (iii–iv) and rigidly paralyzed (v–vi) spines in the cervical region. Posterior vertebral fusion of the spinous processes (sp) is indicated by the continuous cartilaginous staining (green arrow) and fusion of the symphysis joints (SJ) (orange arrow). Scale bars100μm. P; posterior, A; anterior. (C) Representative sagittal 3D views of cervical spine segment (C10–C14) and ventral, sagittal and axial 3D views of C10 from control, prolonged flaccid and prolonged rigid paralysis. Yellow lines and asterisks in ventral view indicate the significant reduction in vertebral body (VB) height of C10 with flaccid and rigid paralysis compared to controls. (D) Representative sagittal 3D views of thoracic spine segment (T4–T7) and ventral, sagittal and axial 3D views of T6 and T7 from control and prolonged rigid paralysis. Yellow lines and asterisks in sagittal view indicate the significant increase in vertebral sagittal width in T6 and T7 with prolonged rigid paralysis compared to controls. Scale bar 1000μm. (E) Box plots showing significant reductions in VB height of C10 and increases in the sagittal width of T6 and T7 following prolonged rigid paralysis. * p≤0.05.
