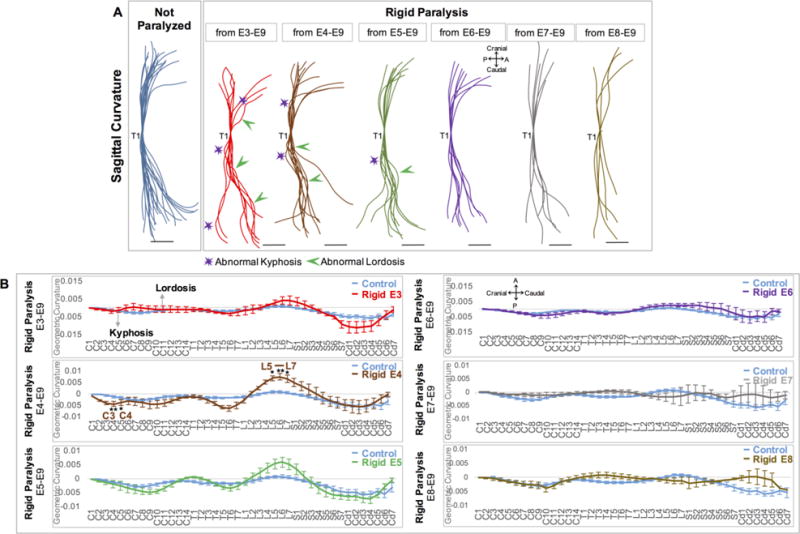
Figure 4.

Initiation of rigid paralysis on or prior to E5 led to reversals and exaggerations of curvature, while paralysis from E4 led to significant alterations in curvatures in five discrete locations. (A) Overlays of curvatures in sagittal plane of control spines (blue, n=21), and timed paralysis spines (E3–E9: red, n=8; E4–E9: brown, n=10; E5–E9: green, n=9; E6–E9: purple, n=8; E7–E9: grey, n=6; E8–E9: mustard, n=5). All spines aligned to thoracic vertebra 1 (T1). Regions of pronounced abnormal lordosis (green arrows) and kyphosis (purple stars) are highlighted. Scale Bars 2000μm. P; posterior, A; Anterior. (B) GC analysis of each group. Y-axis; 1/ radius of curvature, represented by arbitrary units of length. GC>0 lordotic curve, GC<0 kyphotic curve, GC=0 straight spine. X-axis; the craniocaudal individual vertebrae. Significant differences in curvature were found in spines paralyzed from E4–E9, * p≤0.05, ** p≤0.01. C; cervical, T; thoracic, L; lumbar, S; sacral, Cd; caudal.
