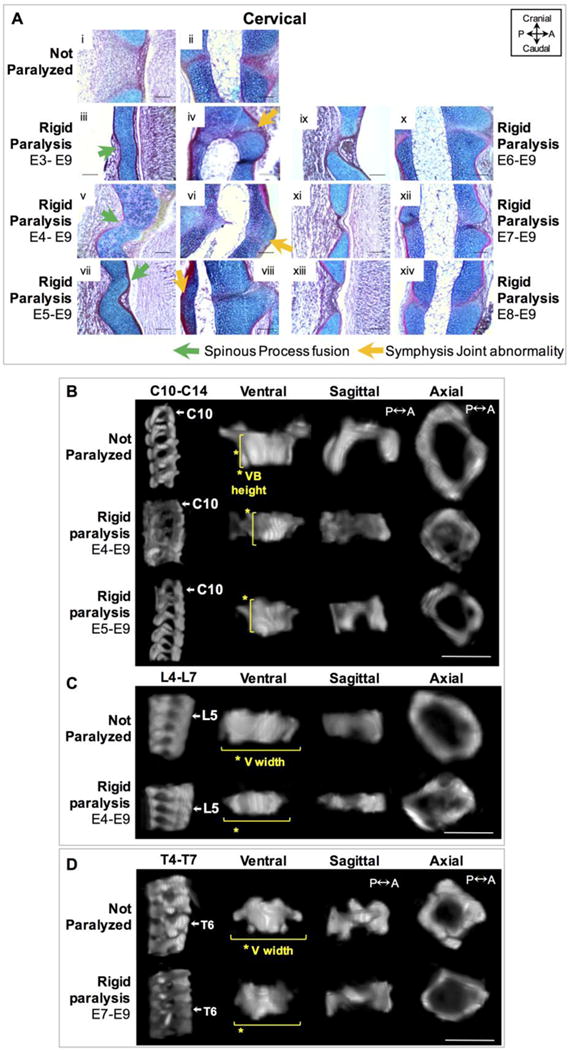
Figure 5.

Initiation of rigid paralysis on or prior to E5 induced posterior vertebral cartilaginous fusion and discrete changes in vertebral shape, while paralysis on or after E6 showed normal segmentation but discrete shape changes in the thoracic region. (A) Sagittal alcian blue (cartilage) and picro–sirus red (collagen) stained sections of posterior spinous process (i, iii, v, vii, ix, xi, xiii) and anterior symphysis joints (ii, iv, vi, viii, x, xii, xiv) in control (i–ii) and timed rigid paralysis spines in the cervical region. Posterior vertebral fusion of the spinous process (sp) is indicated by the continuous cartilaginous staining (green arrows) as is fusion of the symphysis joints (SJ) (orange arrow). Scale bars100μm. P; posterior, A; anterior. (B) Representative sagittal 3D views of cervical spine segment (C10–C14) and ventral, sagittal and axial 3D views of C10 from control and rigid (E4–E9, E5–E9) paralysis groups. (C) Representative sagittal 3D views of lumbar spine segment (L4–L7) and ventral, sagittal and axial 3D views of L5 from control and rigid (E4–E9) paralysis groups. (D) Representative sagittal 3D views of thoracic spine segment (T4–T7) and ventral, sagittal and axial 3D views of T6 from control, rigid (E7–E9) paralysis. (B–D) Yellow lines indicate the significant differences with paralysis compared to controls. Scale bar 1000μm.
