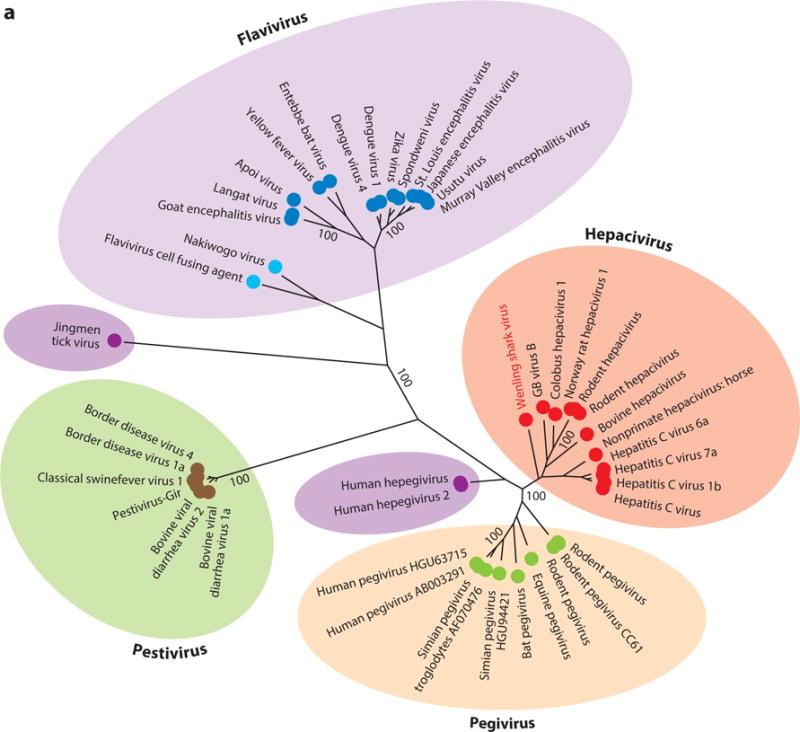
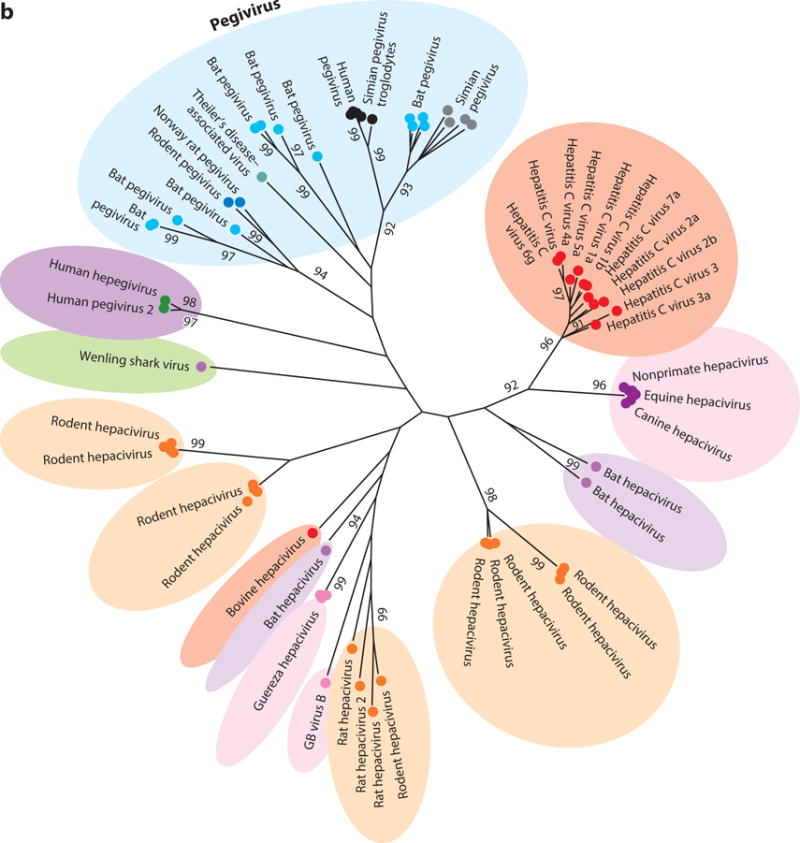
Figure 2.


Phylogenetic analysis of helicase gene (motifs I to IV) of representative members of (a) all four genera of the family Flaviviridae plus newly identified viruses and (b) the two genera Hepacivirus and Pegivirus. The evolutionary history was inferred using the maximum likelihood method based on the Le and Gascuel 2008 model (112). The tree with the highest log likelihood (−47,019.0830) is shown. The percentage of trees in which the associated taxa clustered together is shown next to each branch. Initial trees for the heuristic search were obtained automatically by applying Neighbor-Join (NJ) and BIONJ algorithms to a matrix of pairwise distances estimated by using a JTT model and then selecting the topology with superior log likelihood value. A discrete gamma distribution was used to model evolutionary rate differences among sites (five categories, +G, parameter = 1.7148). The rate variation model allowed for some sites to be evolutionarily invariable (+I, 3.9855% sites). The tree is drawn to scale, with branch lengths measured in number of substitutions per site. The analysis involved 96 amino acid sequences. There were a total of 276 positions in the final data set. Evolutionary analyses were conducted in MEGA7 (113).
