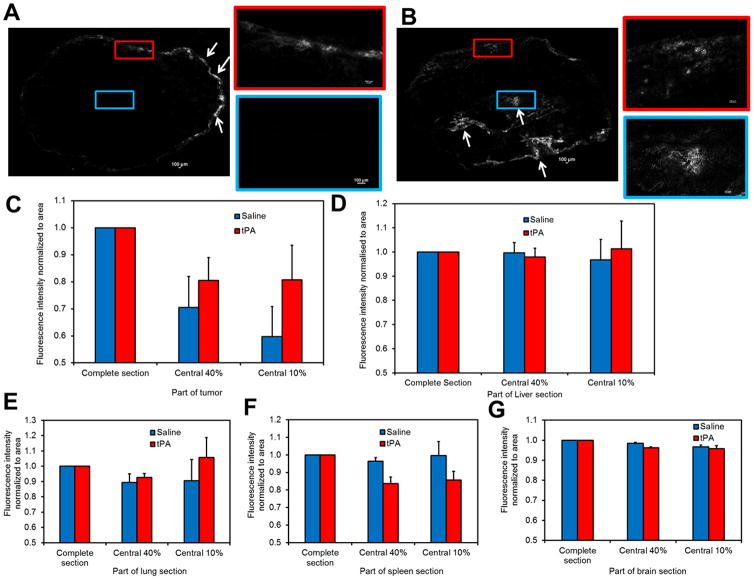
Figure 5. Intratumoral and intraorgan distribution of Doxil® in B16F10 tumors.
Tumor bearing mice were treated with either Doxil or a combination of Doxil and tPA. Animals were sacrificed 24 h later, tumors were collected and fluorescence of doxorubicin was imaged using confocal microscopy. Shown here are representative micrographs of tumors treated with (A) Doxil® or (B) combination of Doxil® and tPA. Arrows indicate fluorescence in tumor sections. Relative fluorescence intensity normalized to area in the entire tissue section and the central 40% and 10% of the tissue area in (C) tumor (D) liver (E) lung (F) spleen (G) brain. Data is represented as mean ± S.E.M., n=3 animals/group. Three tumor sections and one section of normal tissue from each animal were analyzed.

