Figure 1.

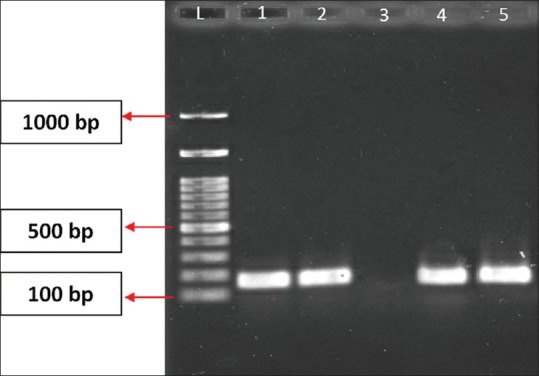
Polymerase chain reaction image of Class 1 integron. L = Ladder 100 bp, 1, 2 and 5 = sample, 3 = negative control, 4 = positive control

Polymerase chain reaction image of Class 1 integron. L = Ladder 100 bp, 1, 2 and 5 = sample, 3 = negative control, 4 = positive control