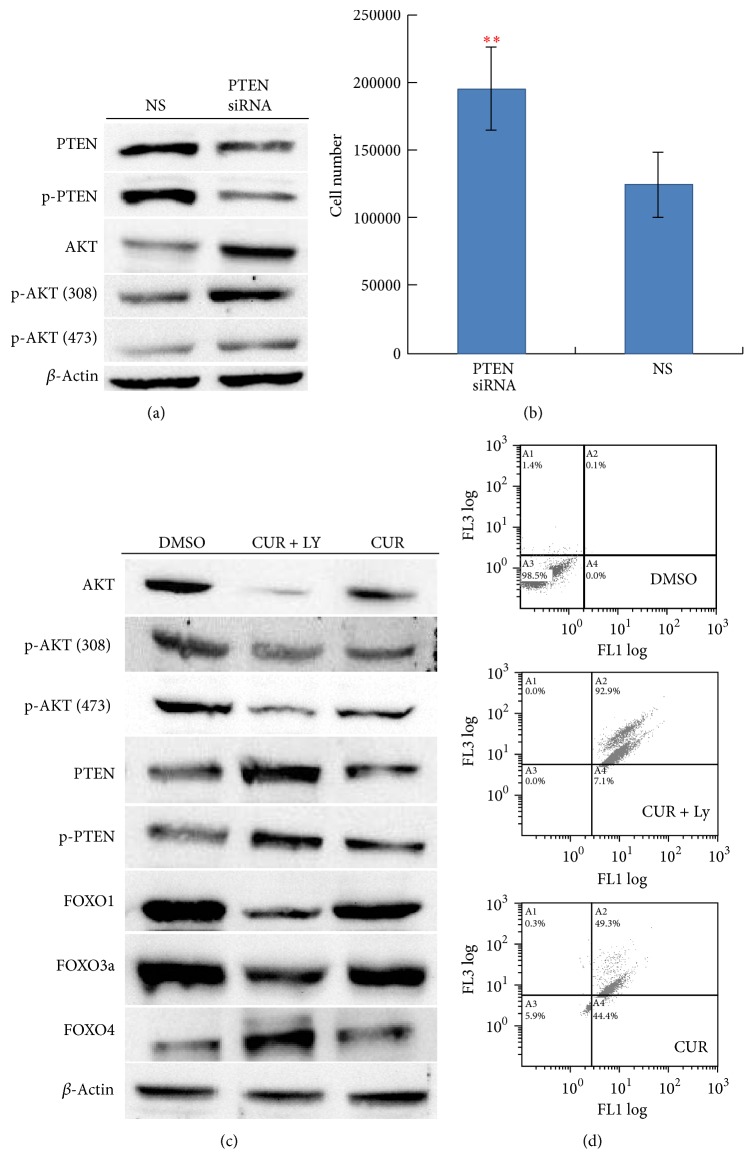
Figure 5.
Associations of PI3K/AKT1/PTEN and curcumin treatment in Hep3B cells. (a) Western blot analysis for AKT1 activation after PTEN knockdown. (b) Hep3B cell viability after PTEN knockdown. The “∗∗” indicates Mann-Whitney U test, p < 0.01. (c) Western blot analysis for AKT1/PTEN/FOXOs protein expression in experiments with and without addition of PI3K inhibitor LY294002 before curcumin treatments. (d) Flow cytometry analysis for caspase-3 activities in experiments with and without addition of PI3K inhibitor LY294002 before curcumin treatments. y-axis indicates propidium iodide (PI) intensities; x-axis indicates caspase activities. The concentration of curcumin used in the experiments was 50 μM. The data are representative of triplicate experiments. CUR: curcumin. DMSO: dimethyl sulfoxide (solvent of curcumin). LY: LY294002.

