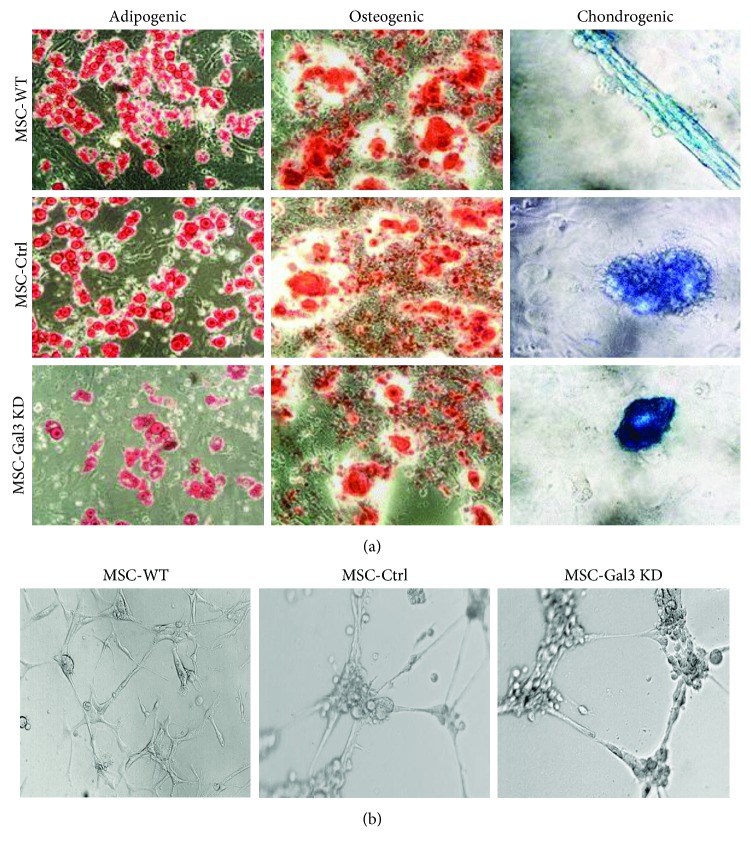
Figure 2.
Characterization of MSC lines by differentiation assays. (a) Trilineage differentiation assay performed in MSC lines to generate adipocytes, visualized by Oil red staining, osteocytes, visualized by alizarin red staining, and chondrocytes, visualized by Alcian blue staining, respectively. (b) Angiogenic ability demonstrated by endothelial tube formation assay on Matrigel. MSC-WT = wild-type MSC; MSC-Ctrl = MSC transduced with a nontargeting shRNA vector; MSC-Gal3KD = Gal-3 knockdown MSC. Magnification = 200x.

