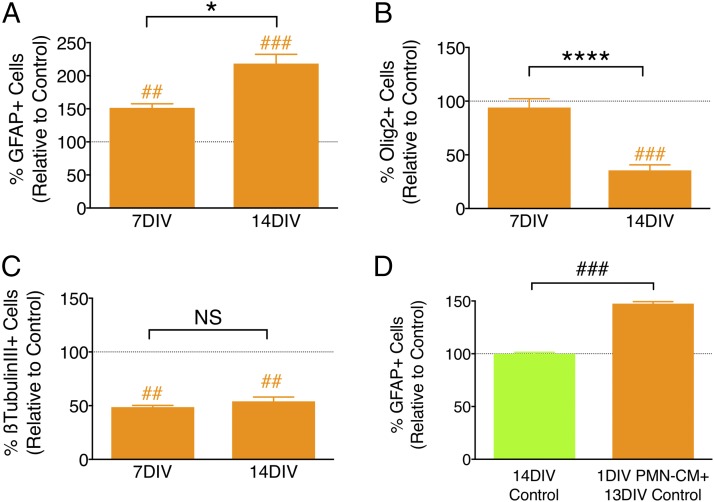
FIGURE 3.
PMN-driven astroglial differentiation increases over time and does not require continuous exposure to CM. (A–C) PMN-CM (orange bars) versus DM control (dashed line) comparisons were conducted using one-sample t tests (##p < 0.01, ###p < 0.001). Comparisons between groups were performed using one-tailed Student t tests (*p < 0.05, ****p < 0.0001). (A) PMN-CM increased the percentage of GFAP+ cells versus DM control by 7 DIV, which was further enhanced by 14 DIV. (B) PMN-CM decreased the percentage of nuclear Olig2+ cells after 14 DIV, but not 7 DIV. (C) PMN-CM decreased the percentage of β-tubulin III+ cells by 7 DIV, which was maintained through 14 DIV. (D) Transient 24-h (1 DIV) exposure of hNSC to PMN-CM increased the percentage of GFAP+ cells versus DM control (green bar and dashed line) by 14 DIV. n = 2 technical replicates and n = 3–4 biological replicates/condition. Mean ± SEM.

