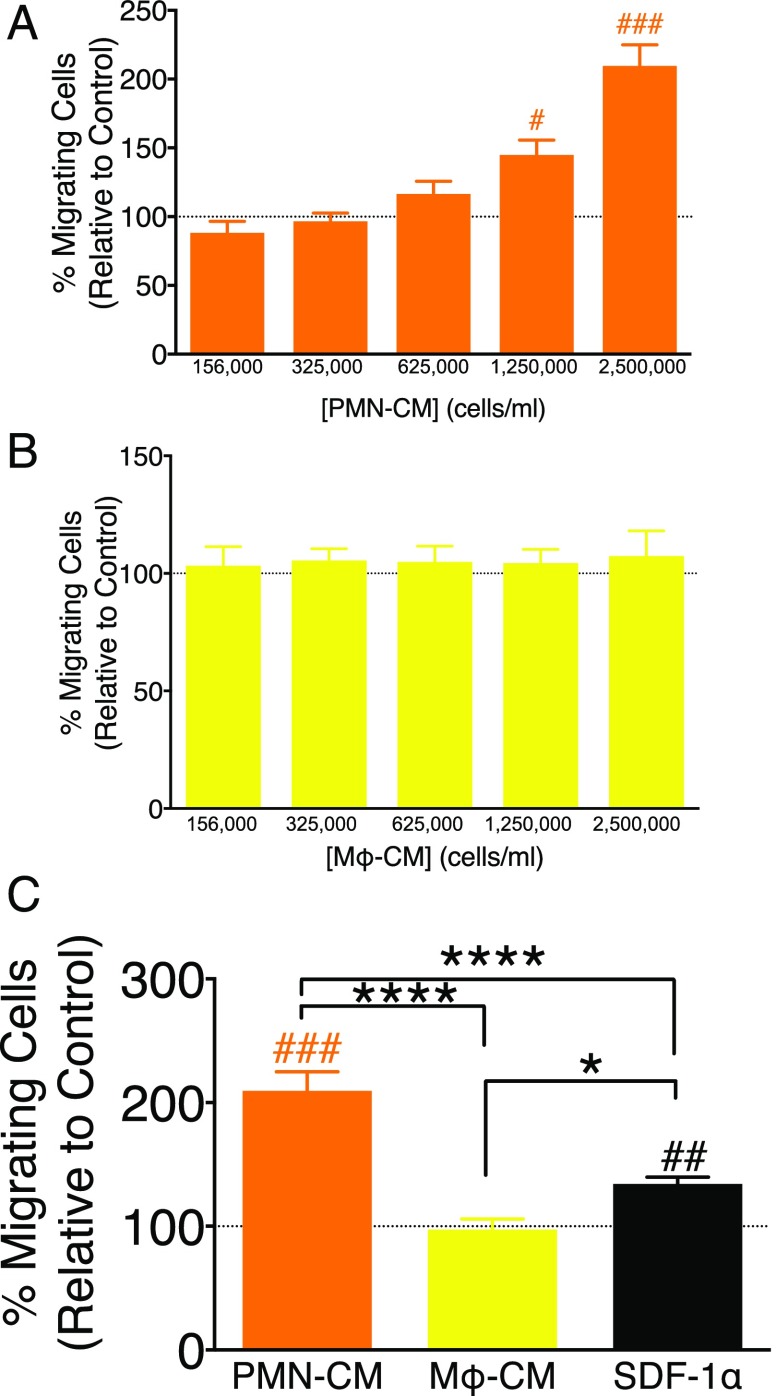
FIGURE 4.
PMN-CM promotes hNSC migration in vitro. (A–C) hNSC migration toward DM control (dashed line), PMN-CM (orange bars), Mϕ-CM (yellow bars), and SDF1α (black bar, positive migration control) was quantified in Transwell assays. CM versus DM control comparisons were conducted using one-sample t tests (#p < 0.05, ##p < 0.01, ###p < 0.001). Comparisons between PMN-CM, Mϕ-CM, and SDF1α groups were conducted using one-way ANOVA, followed by Tukey post hoc tests (****p < 0.0001, *p < 0.05). (A) Increasing PMN-CM seeding density increased hNSC migration. (B) Increased Mϕ-CM seeding density did not alter hNSC migration. (C) PMN-CM (seeding density 2,500,000 cells/ml) increased hNSC migration versus DM control, Mϕ-CM (seeding density 2,500,000 cells/ml), and SDF1α (200 ng/ml). SDF1α increased hNSC migration versus DM control and Mϕ-CM. n = 2 technical replicates and n = 3–4 biological replicates/condition. Mean ± SEM.

