FIGURE 5.
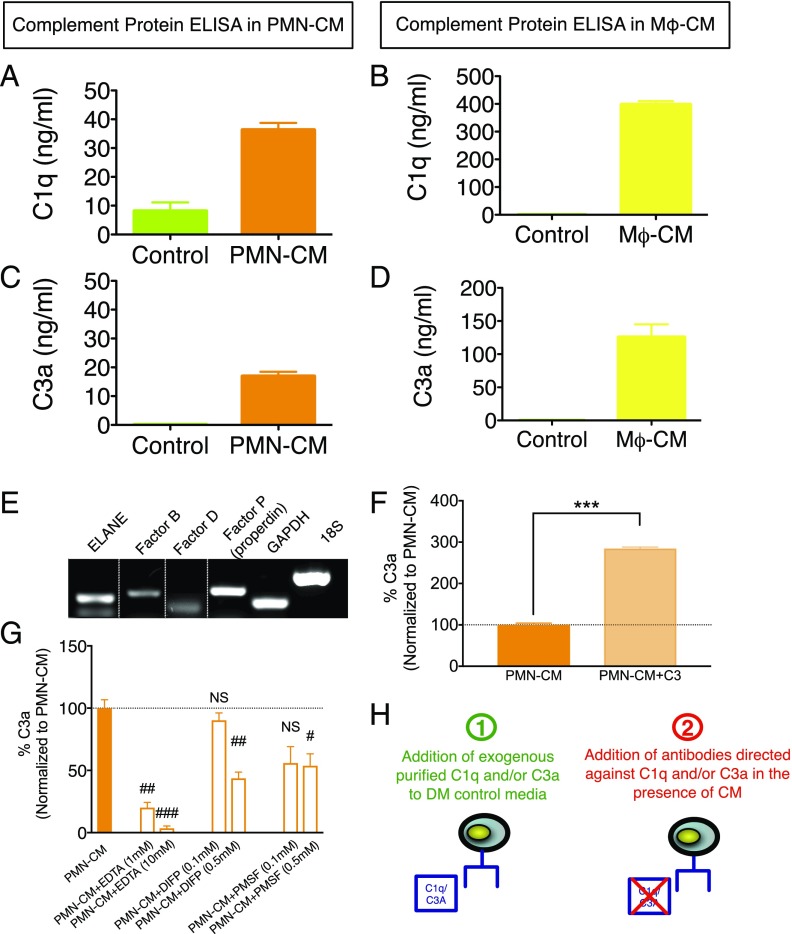
PMN synthesize C1q and C3a. (A–D) n = 2 technical replicates and n = 3–4 biological replicates/condition. (A and B) ELISA quantification of C1q in DM control (green bars) versus PMN-CM (orange bars) and Mϕ-CM (yellow bars) revealed 28 and 400 ng/ml, respectively. (C and D) ELISA quantification of C3a in DM control (green bars) versus PMN-CM (orange bars) and Mϕ-CM (yellow bars) revealed 18 and 120 ng/ml, respectively. (E) RT-PCR analyses demonstrated constitutive expression of ELANE, factor B, factor D, and properdin (factor P) by PMN. The dotted lines indicate where parts of the image were joined. (F and G) n = 2 technical replicates and n = 3 biological replicates/condition. (F) ELISA measurement of C3a generation by cultured PMN (orange bar) and cultured PMN to which 1 μg/ml C3 was added (light orange bar). C3 addition to PMN resulted in a significant increase in C3a present in PMN-CM (Student t test, ***p < 0.001). (G) ELISA measurement of C3a generation by PMN in the presence of EDTA, DIFP, or PMSF at the indicated concentrations. PMN-CM shown as orange bar and dashed line. Both divalent cation chelation and serine protease inhibition resulted in significant decreases in C3a present in PMN-CM (one-sample t test versus PMN-CM; #p < 0.05, ##p < 0.01, ###p < 0.001). (H) Diagram illustrating the two approaches used to test the role of C1q and/or C3a in mediating cell fate and migration in Figs. 6–8: 1) addition of exogenous purified C1q and/or C3a to DM control media (in the absence of PMN-CM and/or Mϕ-CM), and 2) addition of Abs directed against C1q and/or C3a in the presence of PMN-CM. Mean ± SEM.

