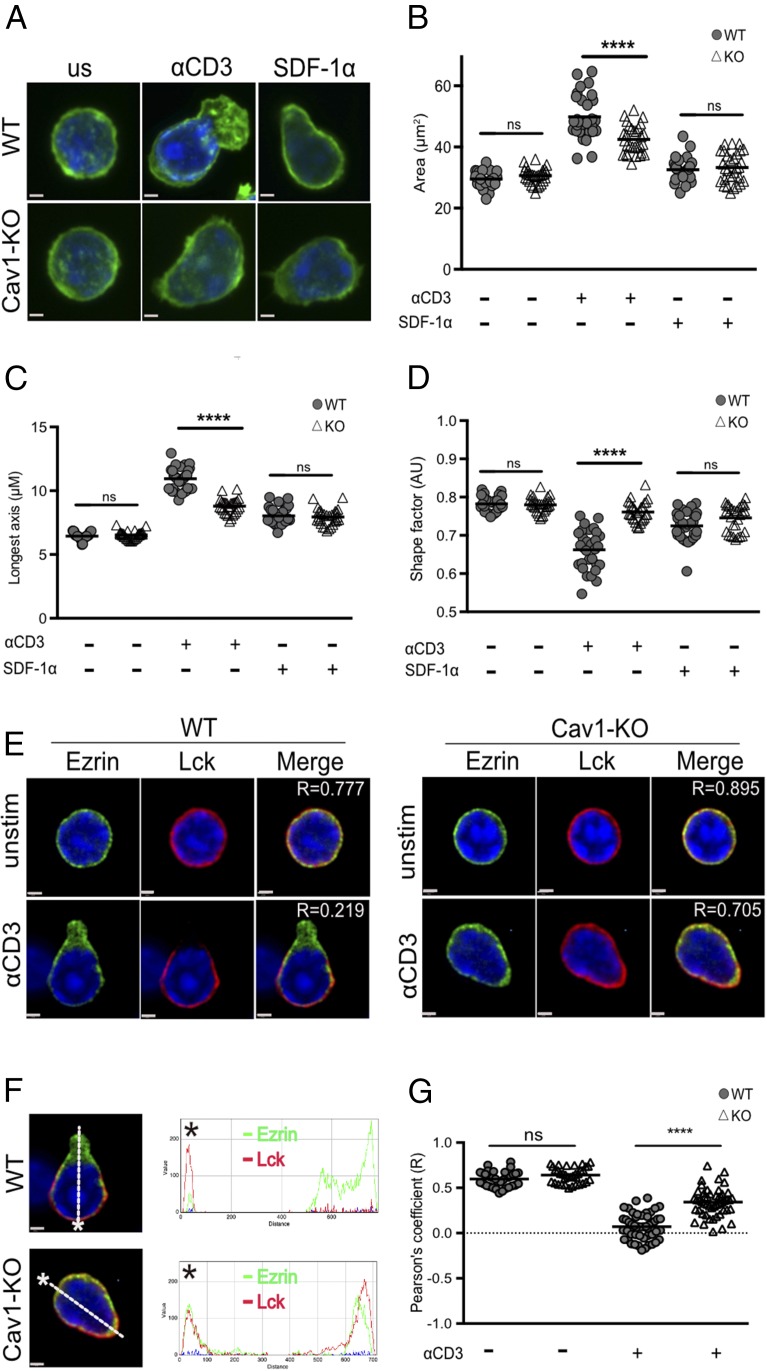
FIGURE 4.
Absence of Cav1 alters CD8 T cell morphology and polarization upon adhesion to ICAM-1. Cav1-WT and Cav1-KO OT-1 CD8 T cells were allowed to adhere for 30 min to glass slides with and without 3 μg/ml ICAM-1 coating. (A) Cells were stained with BODIPY-Fl (green) to define the cell perimeter. Cav1-WT and Cav1-KO CD8 T cells spreading on ICAM-1 were quantified in terms of (B) area, (C) longest axis, and (D) shape factor. For shape factor, a value of 1 is circular. (B–D) Small horizontal lines indicate the mean. (E and F) Cells were stained with Ezrin (green) and Lck (red). Merge images were sectioned (white line) from the leading edge, indicated by the asterisk, to the uropod, generating an RGB histogram using ImageJ software. The histogram line indicates the distribution and MFI of proteins throughout the cross-section of the cell. (G) A Pearson correlation coefficient was calculated by Volocity software, and p values were calculated by the Student t test. Data are representative of one of three independent experiments with a minimum of 100 cells per condition. Scale bars, 1 μm. ****p ≤ 0.001.

